

Cationic isotachophoresis separation of the biomarker cardiac troponin I from a high-abundance contaminant, serum albumin
- PMID: 24723384
- PMCID: PMC4230826
- DOI: 10.1002/elps.201400009
Cationic isotachophoresis separation of the biomarker cardiac troponin I from a high-abundance contaminant, serum albumin
Abstract
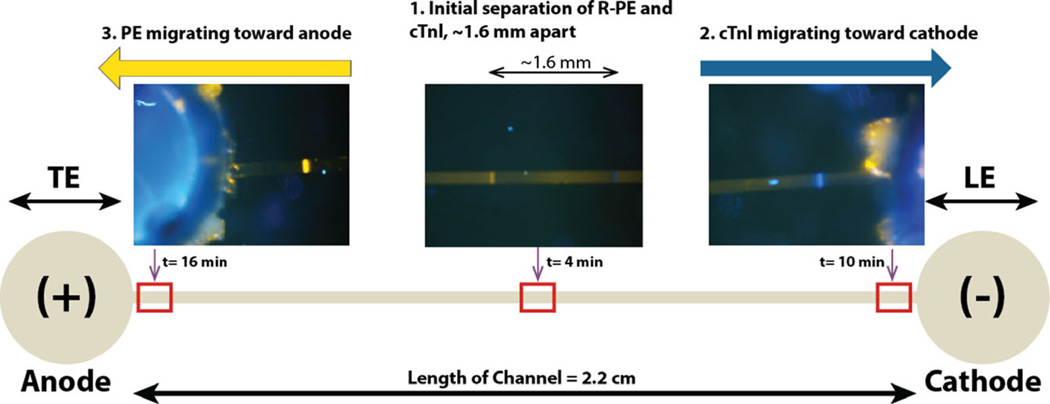
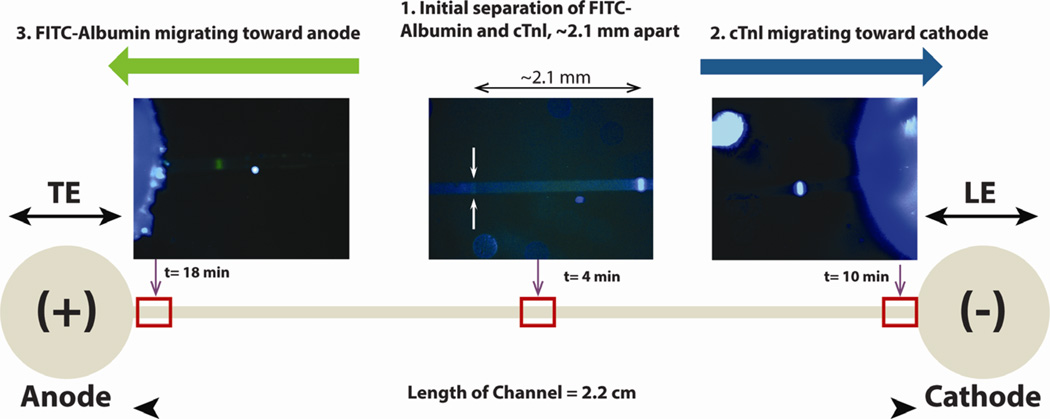
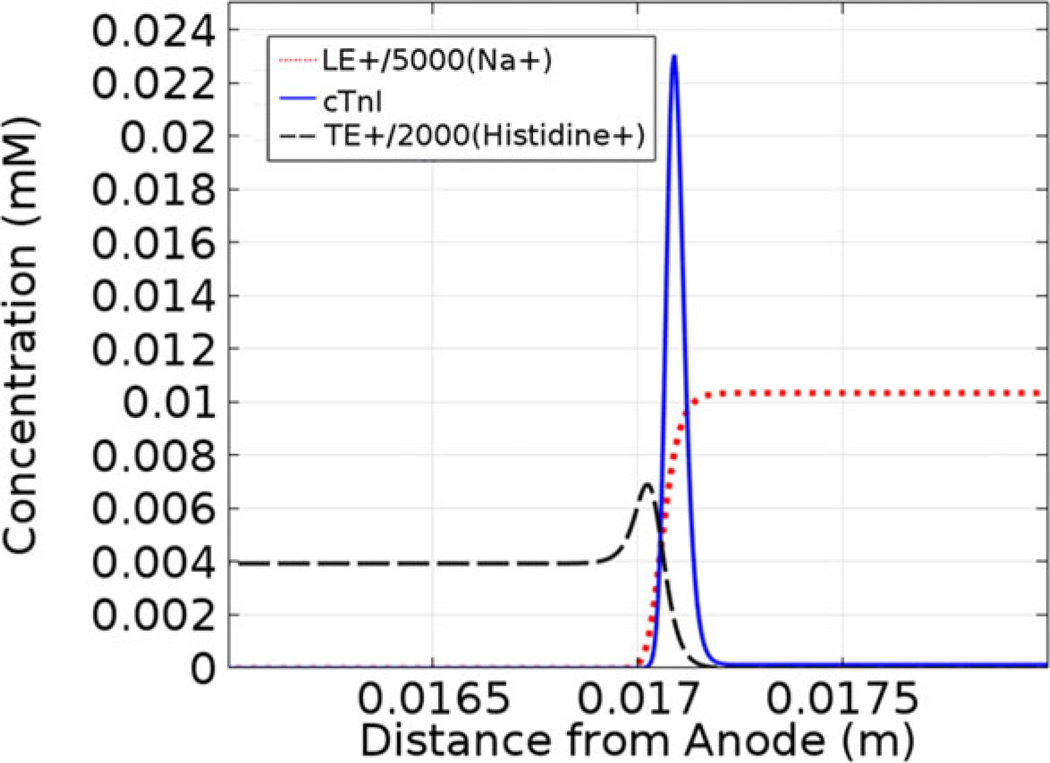
Cationic ITP was used to separate and concentrate fluorescently tagged cardiac troponin I (cTnI) from two proteins with similar isoelectric properties in a PMMA straight-channel microfluidic chip. In an initial set of experiments, cTnI was effectively separated from R-Phycoerythrin using cationic ITP in a pH 8 buffer system. Then, a second set of experiments was conducted in which cTnI was separated from a serum contaminant, albumin. Each experiment took ∼10 min or less at low electric field strengths (34 V/cm) and demonstrated that cationic ITP could be used as an on-chip removal technique to isolate cTnI from albumin. In addition to the experimental work, a 1D numerical simulation of our cationic ITP experiments has been included to qualitatively validate experimental observations.
Keywords: Cardiac troponin I; Cationic isotachophoresis; Microfluidics; Preconcentration; Proteins.
© 2014 WILEY-VCH Verlag GmbH & Co. KGaA, Weinheim.
Conflict of interest statement
Figures
Similar articles
-
Paper-based cascade cationic isotachophoresis: Multiplex detection of cardiac markers.Talanta. 2019 Dec 1;205:120112. doi: 10.1016/j.talanta.2019.07.007. Epub 2019 Jul 2. Talanta. 2019. PMID: 31450472 Free PMC article.
-
Preconcentration and detection of the phosphorylated forms of cardiac troponin I in a cascade microchip by cationic isotachophoresis.Lab Chip. 2011 Nov 21;11(22):3793-801. doi: 10.1039/c1lc20469f. Epub 2011 Sep 21. Lab Chip. 2011. PMID: 21935555 Free PMC article.
-
10,000-fold concentration increase of the biomarker cardiac troponin I in a reducing union microfluidic chip using cationic isotachophoresis.Lab Chip. 2011 Mar 7;11(5):890-8. doi: 10.1039/c0lc00490a. Lab Chip. 2011. PMID: 21416810 Free PMC article.
-
Isotachophoresis: Theory and Microfluidic Applications.Chem Rev. 2022 Aug 10;122(15):12904-12976. doi: 10.1021/acs.chemrev.1c00640. Epub 2022 Jun 22. Chem Rev. 2022. PMID: 35732018 Free PMC article. Review.
-
Microfluidic isotachophoresis: a review.Electrophoresis. 2013 Jun;34(11):1493-509. doi: 10.1002/elps.201300021. Epub 2013 May 14. Electrophoresis. 2013. PMID: 23529957 Review.
Cited by
-
Immunobinding-induced alteration in the electrophoretic mobility of proteins: An approach to studying the preconcentration of an acidic protein under cationic isotachophoresis.Electrophoresis. 2019 May;40(9):1314-1321. doi: 10.1002/elps.201800441. Epub 2019 Feb 7. Electrophoresis. 2019. PMID: 30656700 Free PMC article.
-
Dynamic computer simulations of electrophoresis: 2010-2020.Electrophoresis. 2022 Jan;43(1-2):10-36. doi: 10.1002/elps.202100191. Epub 2021 Aug 2. Electrophoresis. 2022. PMID: 34287996 Free PMC article. Review.
-
Porous Silicon-Based Aptasensors: Toward Cancer Protein Biomarker Detection.ACS Meas Sci Au. 2021 Oct 20;1(2):82-94. doi: 10.1021/acsmeasuresciau.1c00019. Epub 2021 Aug 25. ACS Meas Sci Au. 2021. PMID: 34693403 Free PMC article.
-
Characterization and Optimization of Isotachophoresis Parameters for Pacific Blue Succinimidyl Ester Dye on a PDMS Microfluidic Chip.Micromachines (Basel). 2020 Oct 22;11(11):951. doi: 10.3390/mi11110951. Micromachines (Basel). 2020. PMID: 33105673 Free PMC article.
-
Paper-based cascade cationic isotachophoresis: Multiplex detection of cardiac markers.Talanta. 2019 Dec 1;205:120112. doi: 10.1016/j.talanta.2019.07.007. Epub 2019 Jul 2. Talanta. 2019. PMID: 31450472 Free PMC article.
References
-
- Go AS, Mozaffarian D, Roger VL, Benjamin EJ, Berry JD, Borden WB, Bravata DM, Dai S, Ford ES, Fox CS, Franco S, Fullerton HJ, Gillespie C, Hailpern SM, Heit JA, Howard VJ, Huffman MD, Kissela BM, Kittner SJ, Lackland DT, Lichtman JH, Lisabeth LD, Magid D, Marcus GM, Marelli A, Matchar DB, McGuire DK, Mohler ER, Moy CS, Mussolino ME, Nichol G, Paynter NR, Schreiner RJ, Sorlie RD, Stein J, Turan TN, Virani SS, Wong ND, Woo D, Turner MB. Circulation. 2013;727:e6–e245. - PMC - PubMed
-
- Mohammed MI, Desmulliez MP. Lab. Chip. 2011;11:569–595. - PubMed
-
- La Vecchia L, Mezzena G, Zanolla L, Paccanaro M, Varotto L, Bonanno C, Ometto R. J. Heart Lung Transplant. 2000;79:644–652. - PubMed
-
- Logeart D, Beyne P, Cusson C, Tokmakova M, Leban M, Guiti C, Bourgoin R, Solal AC. Am Heart J. 2001;747:247–253. - PubMed
Publication types
MeSH terms
Substances
Grants and funding
LinkOut - more resources
Full Text Sources
Other Literature Sources
Research Materials
