. 2014 May 22;123(21):3305-15.
doi: 10.1182/blood-2014-02-554071. Epub 2014 Apr 10.

TPL2 kinase regulates the inflammatory milieu of the myeloma niche

Affiliations

TPL2 kinase regulates the inflammatory milieu of the myeloma niche

Chelsea Hope et al. Blood. .

Abstract

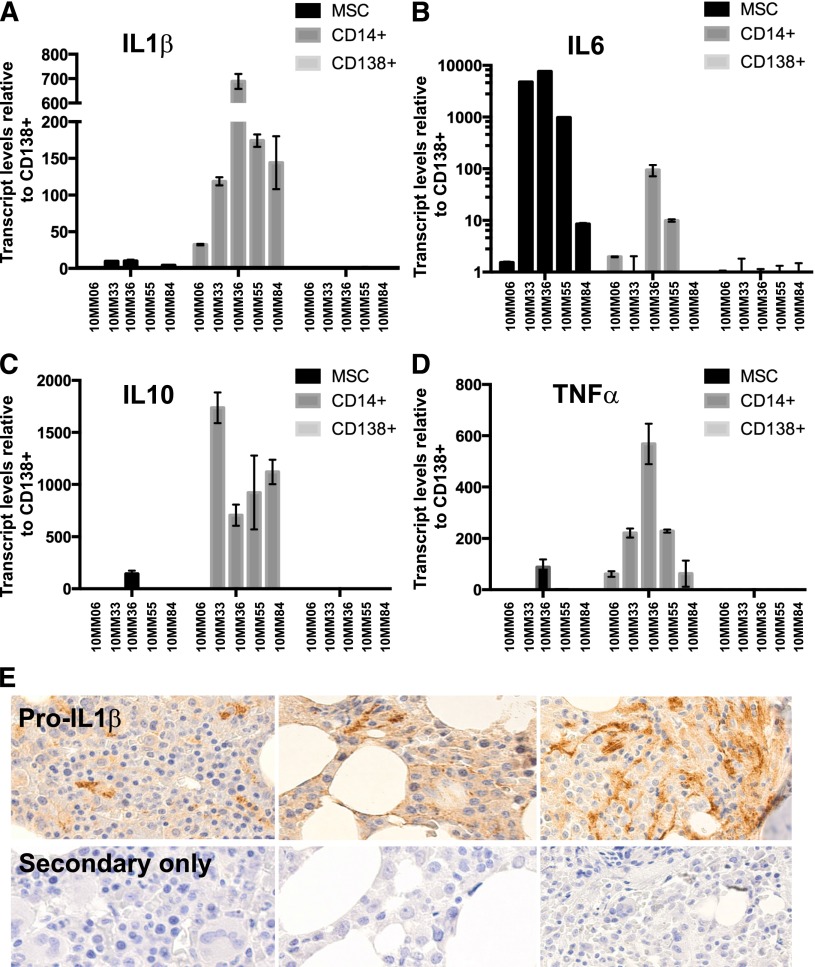
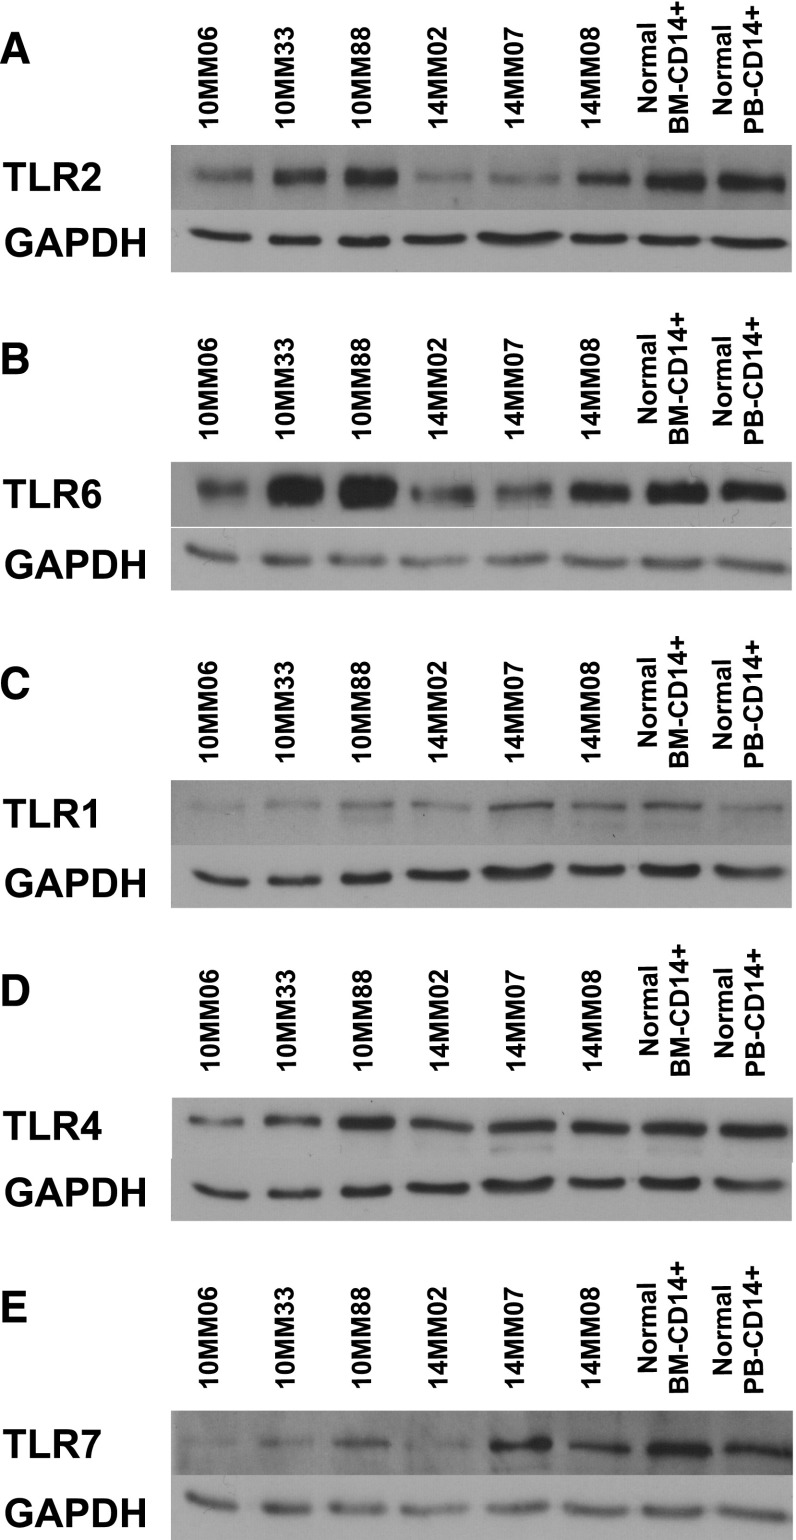
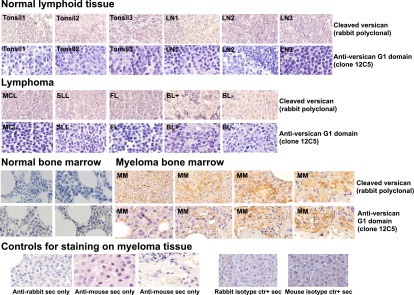
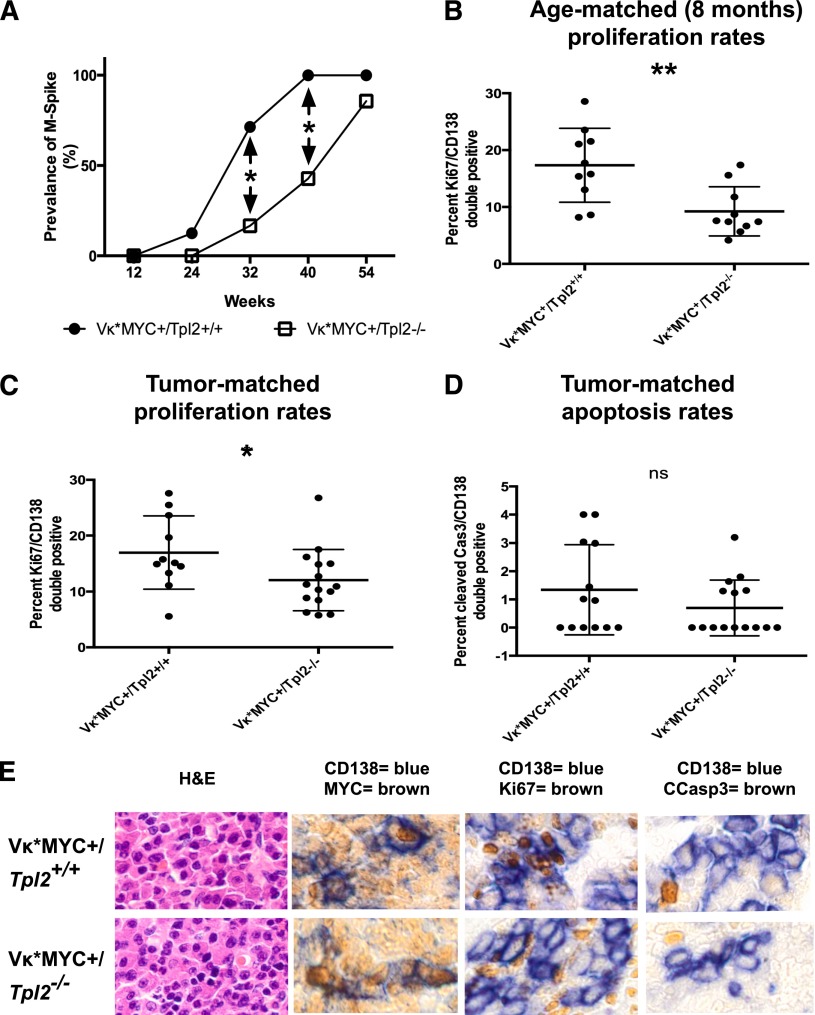
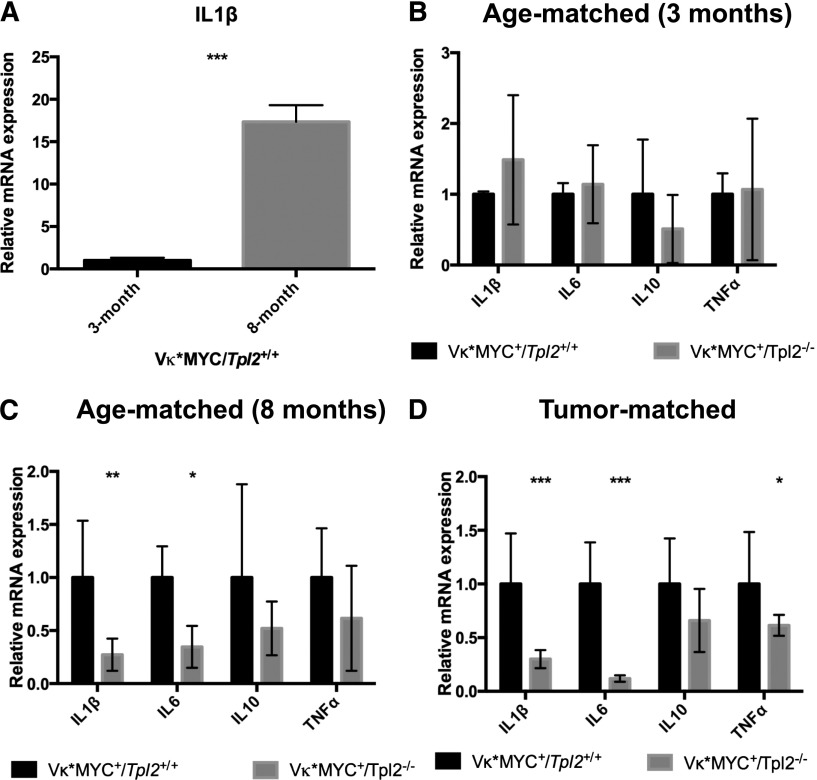
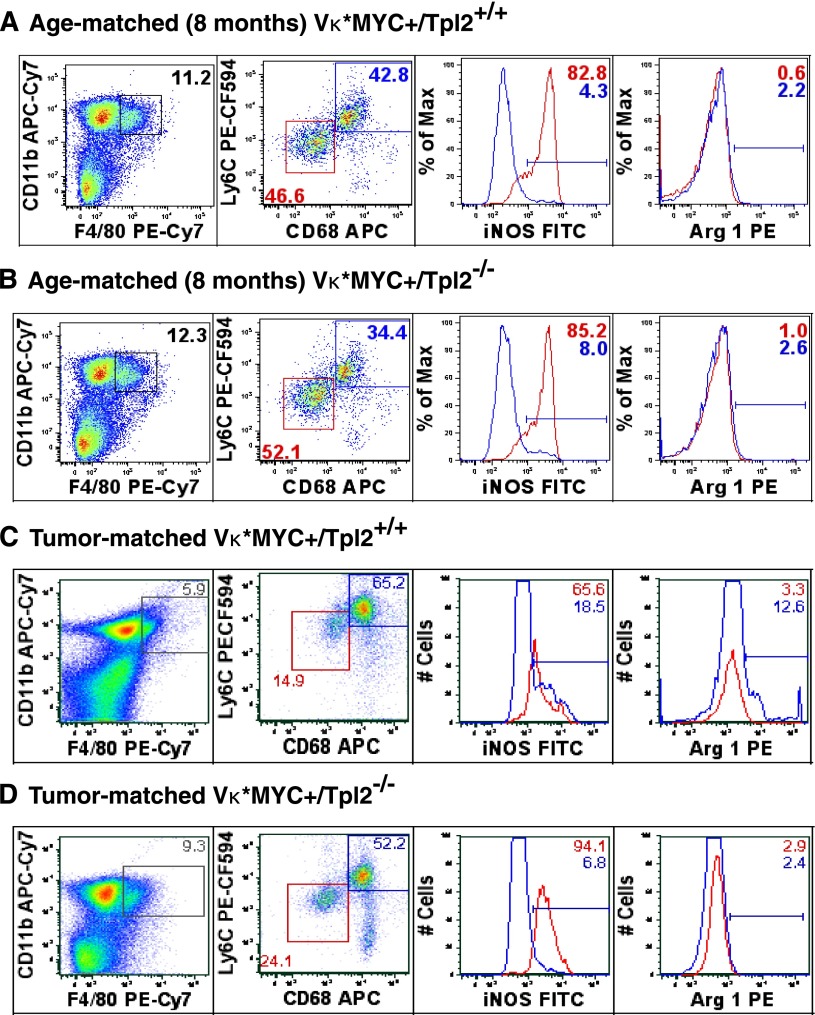
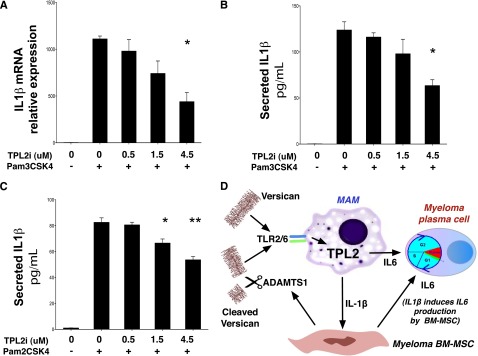
Targeted modulation of microenvironmental regulatory pathways may be essential to control myeloma and other genetically/clonally heterogeneous cancers. Here we report that human myeloma-associated monocytes/macrophages (MAM), but not myeloma plasma cells, constitute the predominant source of interleukin-1β (IL-1β), IL-10, and tumor necrosis factor-α at diagnosis, whereas IL-6 originates from stromal cells and macrophages. To dissect MAM activation/cytokine pathways, we analyzed Toll-like receptor (TLR) expression in human myeloma CD14(+) cells. We observed coregulation of TLR2 and TLR6 expression correlating with local processing of versican, a proteoglycan TLR2/6 agonist linked to carcinoma progression. Versican has not been mechanistically implicated in myeloma pathogenesis. We hypothesized that the most readily accessible target in the versican-TLR2/6 pathway would be the mitogen-activated protein 3 (MAP3) kinase, TPL2 (Cot/MAP3K8). Ablation of Tpl2 in the genetically engineered in vivo myeloma model, Vκ*MYC, led to prolonged disease latency associated with plasma cell growth defect. Tpl2 loss abrogated the "inflammatory switch" in MAM within nascent myeloma lesions and licensed macrophage repolarization in established tumors. MYC activation/expression in plasma cells was independent of Tpl2 activity. Pharmacologic TPL2 inhibition in human monocytes led to dose-dependent attenuation of IL-1β induction/secretion in response to TLR2 stimulation. Our results highlight a TLR2/6-dependent TPL2 pathway as novel therapeutic target acting nonautonomously through macrophages to control myeloma progression.


Figures

Figure 1
Figure 1
Macrophages are a dominant source of inflammatory cytokines in the myeloma microenvironment at diagnosis. The relative expression of RNA encoding myeloma-promoting inflammatory cytokines was compared among paired CD14+, CD138+, and MSC fractions (see supplemental data for clinical information). (A) IL-1β, (B) IL-6, (C) IL-10, and (D) TNF-α levels. (E) To confirm IL-1β message translation in the myeloma microenvironment, we stained a myeloma TMA with an antibody against (pro)IL-1β protein. (Pro)IL-1β staining was seen associated with cells of monocytic lineage morphology.
Figure 2
Figure 2
Coregulation of TLR2 and TLR6 expression in MAMs. Lysates from CD14+ MAM obtained from BM aspirates at diagnosis were immunoblotted using a panel of antibodies against TLRs. Human primary BM-derived CD14+ cells and human primary peripheral blood (PB)-derived CD14+ cells served as controls. GAPDH provided a loading control. (A) TLR2/GAPDH. (B) TLR6/GAPDH. (C) TLR1/GAPDH. (D) TLR4/GAPDH. (E) TLR7/GAPDH. GAPDH, glyceraldehyde-3-phosphate dehydrogenase.
Figure 3
Figure 3
Versican expression in lymphoid malignancies and normal tissues. Tissue from a lymphoma and a myeloma TMA (see “Materials and methods”) was stained with antibodies recognizing a neo-epitope generated by cleavage of versican by ADAMTS1/4 (“cleaved versican”) and an antibody against the hyaluronan-binding domain of the versican protein core (“G1-domain”). Representative staining patters are shown for normal tissue (tonsils, lymph nodes [LN], BM), a panel of lymphomas (BL+: Burkitt lymphoma with a t(8;14), BL: Burkitt lymphoma without a t(8;14)) and myeloma BM; FL, follicular lymphoma, MCL, mantle cell lymphoma, SLL, small lymphocytic lymphoma. Secondary-only and isotype staining controls are also shown. A summary of the TMA staining scores is provided as supplemental Tables 2 and 3.
Figure 4
Figure 4
Tpl2 loss prolongs latency and reduces the plasma cell proliferative fraction in Vκ*MYC mice. (A) Serial serum protein electrophoresis was used to detect monoclonal gammopathy in a cohort of Vκ*MYC/Tpl2−/− mice (14 animals) and compared with Vκ*MYC/Tpl2+/+ controls (14 animals). Prevalence of M-spikes over time (weeks) in each cohort is shown. The latency at 50% prevalence of monoclonal gammopathy in the control group is 28 weeks and in the Vκ*MYC/Tpl2−/− group is 42 weeks. Cohort sizes were powered (power = 80%) to detect the differences seen at 32 and 40 weeks with a *P < .05. (A) The plasma cell proliferative fraction (CD138+/Ki67+ double-positive cells) was counted against total CD138+ cells by immunohistochemistry, as shown in panel E. Counts were performed in >30 total CD138+ cells from each of >5 high-power fields from 2 mice in each group (at least 150 CD138+ cells per mouse). P values: *<.05, **<.01, ***< .001, ns, nonsignificant. (C) Calculation of the proliferative fraction of CD138+ cells was performed as delineated in panel B, but from 3 animals in each genotype with equivalent M-spikes (tumor-matched). P values: *<.05, **<.01, ***<.001. (D) Apoptotic rates were calculated as the rate of cleaved caspase 3+/CD138+ double-positive cells over total CD138+ cells in tumor-matched mice. Counts were performed in >30 total CD138+ cells from each of >5 high-power fields from 3 mice in each group (at least 150 CD138+ cells per mouse). P values: *<.05, **<.01, ***<.001. (E) Immunohistochemical analysis of the MYC expression, proliferative fraction (Ki67+), apoptotic fraction (cleaved caspase 3+) in CD138+ plasma cells from each genotype as shown (tumor-matched mice). Hematoxylin-eosin (H&E) staining is provided for morphological comparison.
Figure 5
Figure 5
Tpl2−/− monocytes/macrophages display defective inflammatory switch in the myeloma microenvironment. BM aspirates from Vκ*MYC/Tpl2+/+ or Vκ*MYC/Tpl2−/− animals were collected, and monocytic-lineage cells were isolated by CD115+ immunomagnetic separation. Complementary DNA subjected to quantitative RT-PCR using primers recognizing various cytokines as indicated. (A) CD115+ cells from 3-month-old Vκ*MYC mice (0 incidence of M-spikes) do not transcribe appreciable amounts of IL-1β message. By 8 months, most Vκ*MYC mice have developed M-spikes. CD115+ cells at 8 months transcribe high levels of IL-1β message, demonstrating an inflammatory switch equivalent to the induction of inflammatory mediators reported by our group in human MAM. (B) At 3 months of age, Vκ*MYC mice lack monoclonal gammopathy (0 incidence of M-spikes, see Figure 4A). IL-1β message is transcribed at the same low rates regardless of Tpl2 status. (C) By 8 months of age, CD115+ from Vκ*MYC/Tpl2+/+ mice have undergone inflammatory switch, characterized by increased IL-1β production. However, CD115+ cells from Vκ*MYC/Tpl2−/− mice display severe defects in IL-1β and IL-6 production. (D) The defect in inflammatory cytokine production by Tpl2−/− MAM persists even in overt tumor (tumor-matched mice bearing equivalent M-spikes). P values: *<.05, **<.01, ***<.001. mRNA, messenger RNA.
Figure 6
Figure 6
Tumor stage-specific macrophage repolarization in the myeloma niche in the absence of Tpl2. Macrophage polarization was assessed using flow cytometric analysis of C11b+/F4/80+ macrophages from BMs of age-matched (8-month old) and “tumor matched” wild-type (Vκ*MYC/Tpl2+/+) and Vκ*MYC/Tpl2−/− animals. Representative results from 3 animals in each group are shown. The C11b+/F4/80+ gate is shown to the left. The dot plots represent the frequency of the M1-like fraction (CD68int/Ly6Cint) and M2-like fraction (CD68hi/Ly6Chi) in the total C11b+/F4/80+ gate in each genotype. M1 polarization has been shown to result in downregulation of CD68 in macrophages. On the right panels, histograms depict the relative frequency of iNOS+ and Arginase-1+ cells in each subpopulation, depicted in RED (M1-like) and BLUE (M2-like). APC, allophycocyanin; FITC, fluorescein isothiocyanate; PE, phycoerythrin.
Figure 7
Figure 7
TPL2 regulates IL-1β production in response to TLR2 stimulation in human monocytes. (A) Pharmacologic TPL2 inhibition results in a dose-dependent decrease of IL-1β transcription in response to TLR2 stimulation of human monocytes. THP-1 cells were stimulated with a TLR2 agonist, Pam3CSK4, for 3 hours with or without pretreatment with a TPL2 kinase inhibitor as shown. RNA was extracted and subjected to RT-PCR using IL-1β–specific primers. Pam3CSK4 is thought to act predominantly through TLR2/TLR1 heterodimers, whereas a related lipopeptide, Pam2CSK4, acts through TLR2/6 heterodimers. Pharmacologic TPL2 inhibition resulted in dose-dependent decrease of mature IL-1β secretion into culture supernatants after stimulation by either Pam3CSK4 (B) or Pam2CSK4 (C). P values: *<.05, **<.01, ***<.001. Tpl2i, Tpl2 inhibitor. (D) Diagram summarizing the central role of the versican-TLR2/6-TPL2 pathway in regulating the inflammatory milieu of the myeloma niche. TLR2/6 heterodimers on MAM recognize versican cleaved by ADAMTS1 and/or unprocessed versican. Versican-induced TLR2/6 signaling activates TPL2 kinase and is essential for IL-1β and IL-6 induction in the myeloma niche.

References

    1. Lohr JG, Stojanov P, Carter SL, et al. Multiple Myeloma Research Consortium. Widespread genetic heterogeneity in multiple myeloma: implications for targeted therapy. Cancer Cell. 2014;25(1):91–101. - PMC - PubMed
    1. Chapman MA, Lawrence MS, Keats JJ, et al. Initial genome sequencing and analysis of multiple myeloma. Nature. 2011;471(7339):467–472. - PMC - PubMed
    1. Bolli N, Avet-Loiseau H, Wedge DC, et al. Heterogeneity of genomic evolution and mutational profiles in multiple myeloma. Nat Commun. 2014;5:2997. - PMC - PubMed
    1. Egan JB, Shi CX, Tembe W, et al. Whole-genome sequencing of multiple myeloma from diagnosis to plasma cell leukemia reveals genomic initiating events, evolution, and clonal tides. Blood. 2012;120(5):1060–1066. - PMC - PubMed
    1. Keats JJ, Chesi M, Egan JB, et al. Clonal competition with alternating dominance in multiple myeloma. Blood. 2012;120(5):1067–1076. - PMC - PubMed

Publication types

MeSH terms