. 2014 Apr;6(4):988-99.
doi: 10.1093/gbe/evu075.

Genome evolution by matrix algorithms: cellular automata approach to population genetics

Affiliations

Genome evolution by matrix algorithms: cellular automata approach to population genetics

Shuhao Qiu et al. Genome Biol Evol. 2014 Apr.

Abstract

Mammalian genomes are replete with millions of polymorphic sites, among which those genetic variants that are colocated on the same chromosome and exist close to one another form blocks of closely linked mutations known as haplotypes. The linkage within haplotypes is constantly disrupted due to meiotic recombination events. Whole ensembles of such numerous haplotypes are subjected to evolutionary pressure, where mutations influence each other and should be considered as a whole entity-a gigantic matrix, unique for each individual genome. This idea was implemented into a computational approach, named Genome Evolution by Matrix Algorithms (GEMA) to model genomic changes taking into account all mutations in a population. GEMA has been tested for modeling of entire human chromosomes. The program can precisely mimic real biological processes that have influence on genome evolution such as: 1) Authentic arrangements of genes and functional genomic elements, 2) frequencies of various types of mutations in different nucleotide contexts, and 3) nonrandom distribution of meiotic recombination events along chromosomes. Computer modeling with GEMA has demonstrated that the number of meiotic recombination events per gamete is among the most crucial factors influencing population fitness. In humans, these recombinations create a gamete genome consisting on an average of 48 pieces of corresponding parental chromosomes. Such highly mosaic gamete structure allows preserving fitness of population under the intense influx of novel mutations (40 per individual) even when the number of mutations with deleterious effects is up to ten times more abundant than those with beneficial effects.

Keywords: SNPs; fixation; gene; genomics; linkage; neutral theory.


Figures

F<sc>ig</sc>. 1.—
Fig. 1.—
GEMA begins with a genetically identical population of size N. Genomic mutations occur in each individual, which are passed onto offspring. According to the mutations inherited, fitness is calculated for each offspring. The N fittest offspring become the next generation and the process repeats for thousands of generations. Additional details on GEMA are provided in the Materials and Methods section, supplementary file S1, Supplementary Material online (GEMA user guide), and our GEMA web page.
F<sc>ig</sc>. 2.—
Fig. 2.—
Exemplification of results from GEMA_r1.pl and GEMA_r01.java, illustrating evolutionary computations for 50 virtual individuals, each of whose genome is represented by human chromosome 22. (A) and (B) The change of relative fitness of individuals in population with respect to time (generations). In this modeling, we defined the distribution of mutations as a decay curve of selection coefficient (s), where 88% of mutations have negative s values and only 12% have positive s values (see fig. 3A). We do not normalize selection coefficient values, so the illustrated fitness of individuals is presented in relative units. Negative values of relative fitness show a decline in organism adaptability, whereas positive values indicate improvement. In these computational experiments, genes were assigned codominance mode (h = 0.5). In (A), how different numbers of offspring per individual (α = 3, 5, 8, or 10 offspring) influence the relative fitness, under the same recombination rate (r = 1) is demonstratd. In (B), how different numbers of recombination events per gamete (r = 1, 10, 20, or 48) affect the relative fitness whereas the number of offspring remained constant (α = 5) is demonstrated. (C) and (D) illustrate the dynamics of number of SNPs in the population. (C) Variations in the number of SNPs with respect to generations for four different values of novel mutations per gamete (µ = 2, 8, 20, or 30). In (D), smoothed number of SNPs (by taking averages for extended number of generations) in addition to emphasizing that under specific conditions (e.g., recessive genes in which the dominance mode h is close to 1) there may be considerable and long-lasting spikes in the number of SNPs when recombination rate is low (r ≤ 1) is demonstrated.
F<sc>ig</sc>. 3.—
Fig. 3.—
Distributions of mutations by user-assumed selection coefficients (s-values), which were used for modeling analysis. (A) A continuous distribution of mutations by s that can range from −20 to +20 depending on their deleterious (negative s values) or beneficial (positive s values) effects. This curve represents 88% deleterious and 12% beneficial mutations. (B) A discrete distribution of mutations characterized predominantly by neutral mutations occurring at a frequency of 90% within the population, whereas the remaining 10% is characterized by deleterious and beneficial mutations occurring in a ratio of 9:1. (C) illustrates another discrete distribution for mutations, where the ratio of deleterious to beneficial mutations occurs again in the ratio of 9:1. However, this model is characterized by a preponderance of mutations with deleterious effects (81%). Neutral mutations in this case comprise 10% and beneficial—9% of overall nucleotide changes occurring within the population.
F<sc>ig</sc>. 4.—
Fig. 4.—
Dependence of the probability of fixation πs of mutations with beneficial effects. The effects of mutations have been illustrated in our model according to selection coefficient s exemplified by values of +1, 0, and −1 for beneficial, neutral, and deleterious mutations, respectively. Individual 3D plots demonstrate the quantitative behavior of fixation of mutations as interplay of different parameters represented by population size (N), recombination rate (r), variations in influx of novel mutations (μ), mode of dominance (h), number of off springs (α), and predominance of either neutral mutations (according to fig. 3B) or deleterious mutations (according to fig. 3C). Exact values of all parameters are provided in supplementary tables S1 and S2, Supplementary Material online.
F<sc>ig</sc>. 5.—
Fig. 5.—
Dependence of the probability of fixation πs of mutations with deleterious effects (s = −1). All parameters are the same as in figure 4.
F<sc>ig</sc>. 6.—
Fig. 6.—
Dependence of the probability of fixation πs of mutations with neutral effects (s = 0). All parameters are the same as in figure 4. Note that for comparison of these π values with Kimura’s law, they should be normalized by taking into account the number of offspring per individual as described in the Results section (πskimura = πs × α/2).
F<sc>ig</sc>. 7.—
Fig. 7.—
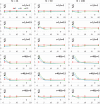
Graphical illustrations of deviations of K/µ ratio from 1 with respect to change of number of novel mutations per gamete (µ) for particular sets of parameters (N, r, h, α, D). K stands for the number of fixed nucleotides in each generation, whereas µ is the number of novel mutations per gamete. The graphs are obtained on the basis of predominant pool of neutral mutations, modeled by experiment B for s distribution (see fig. 3B). Within each graph, variations in the ratio of K/µ have been calculated for varying number of offspring (α) within the population (green α = 2; red α = 5; blue α = 10). In toto, the interplay of various parameters such as recombination rate (r), dominance coefficient (h), population size (N), novel mutations per gamete (µ), number of offspring (α), and overall effect of mutation pool (deleterious, beneficial, or neutral) has been represented as causal factors for deviations from previously assumed unitary ratio of K/µ.
F<sc>ig</sc>. 8.—
Fig. 8.—
Graphical illustrations of deviations of K/µ ratio from 1 with respect to change of number of novel mutations per gamete (µ) for particular sets of parameters (N, r, h, α, D). The graphs are obtained on the basis of a prevalence of deleterious mutations, quantified by experiment C (see fig. 3C). All parameters are the same as in figure 7.

Similar articles

Cited by

References

    1. Abecasis GR, et al. An integrated map of genetic variation from 1,092 human genomes. Nature. 2012;491:56–65. - PMC - PubMed
    1. Bechtel JM, et al. Genomic mid-range inhomogeneity correlates with an abundance of RNA secondary structures. BMC Genomics. 2008;9:284. - PMC - PubMed
    1. Bernardi G. The neoselectionist theory of genome evolution. Proc Natl Acad Sci U S A. 2007;104:8385–8390. - PMC - PubMed
    1. Bodmer WF, Felsenstein J. Linkage and selection: theoretical analysis of the deterministic two locus random mating model. Genetics. 1967;57:237–265. - PMC - PubMed
    1. Carvajal-Rodriguez A. GENOMEPOP: a program to simulate genomes in populations. BMC Bioinformatics. 2008;9:223. - PMC - PubMed

Publication types

LinkOut - more resources