. 2014 Mar 26:8:25.
doi: 10.3389/fninf.2014.00025. eCollection 2014.

A web-portal for interactive data exploration, visualization, and hypothesis testing

Affiliations

A web-portal for interactive data exploration, visualization, and hypothesis testing

Hauke Bartsch et al. Front Neuroinform. .

Abstract

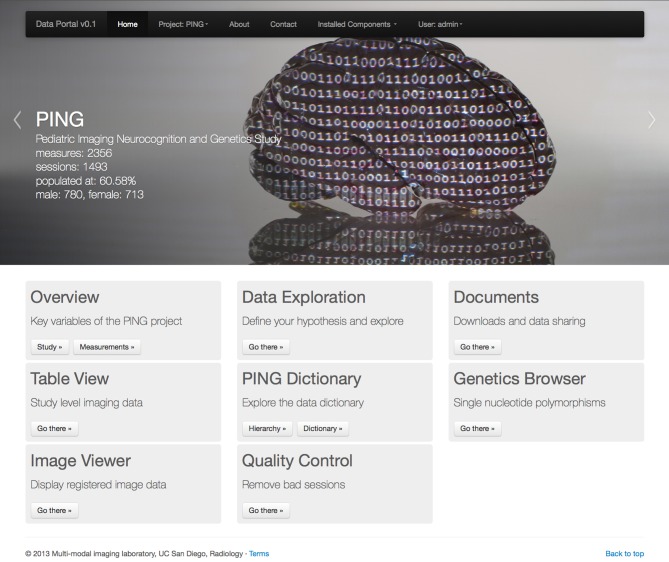
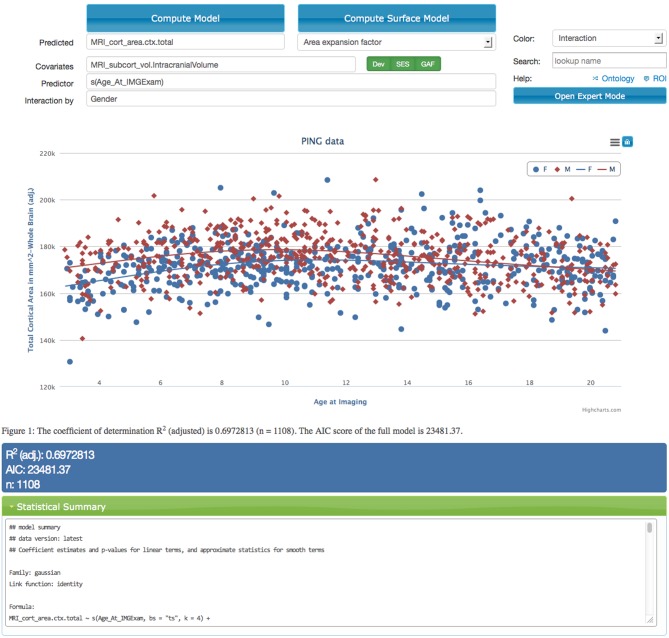
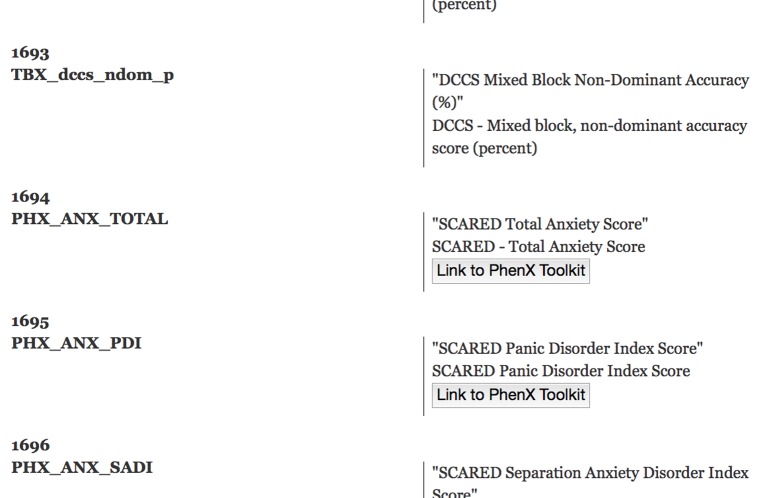
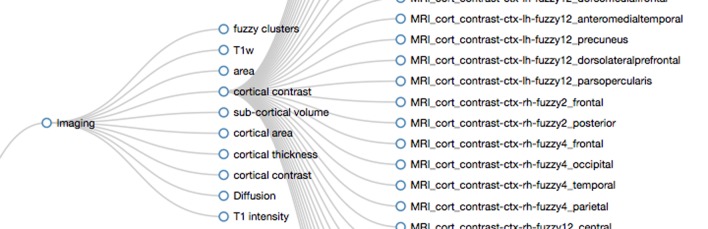
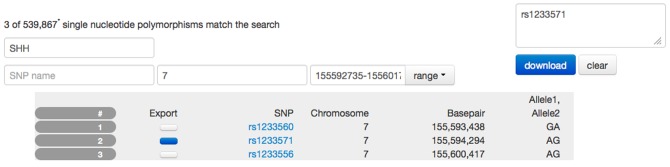
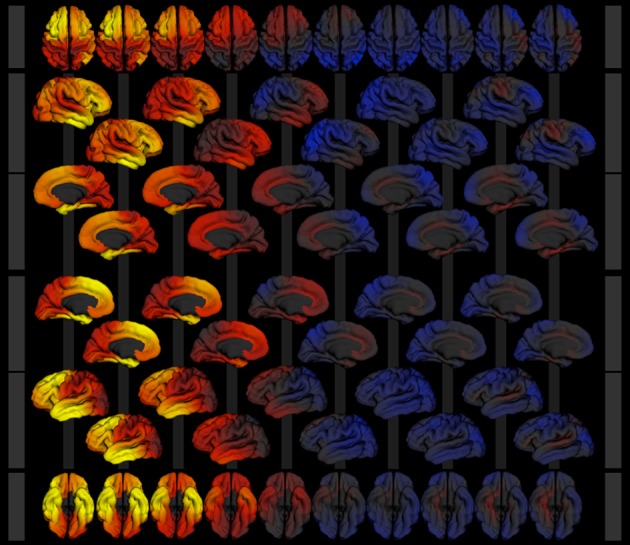
Clinical research studies generate data that need to be shared and statistically analyzed by their participating institutions. The distributed nature of research and the different domains involved present major challenges to data sharing, exploration, and visualization. The Data Portal infrastructure was developed to support ongoing research in the areas of neurocognition, imaging, and genetics. Researchers benefit from the integration of data sources across domains, the explicit representation of knowledge from domain experts, and user interfaces providing convenient access to project specific data resources and algorithms. The system provides an interactive approach to statistical analysis, data mining, and hypothesis testing over the lifetime of a study and fulfills a mandate of public sharing by integrating data sharing into a system built for active data exploration. The web-based platform removes barriers for research and supports the ongoing exploration of data.

Keywords: data dictionary; data exploration; data sharing; genetics; hypothesis testing; imaging.


Figures

Figure 1
Figure 1
Entry page to the PING data portal reflecting the architecture of the data portal as a collection of workflow driven components. A navigation menu structure and project data summary is displayed in the top half of the page followed by a list of eight application groups. See section 2 for a description of each component.
Figure 2
Figure 2
Screen capture of the data exploration application displaying a statistical analysis of the effects of age on the total cortical area for male (red dots and curve) and female (blue dots and curve) children in the PING study. The model corrects for the effects of intra-cranial volume, scanning device, socio-economic factors, and genetic ancestry. Interface components that relate to model specification are shown above the scatter plot. The model is executed on the server using R after selecting the “Compute Model” option. Resulting model curves and residualized data points are plotted together with summary statistics in the middle and lower parts of the web-page. The scatter plot supports an interactive legend, changes in magnification, and data points that link back to imaging data.
Figure 3
Figure 3
Screen capture of the surfer viewer application. Color is used to map the −log10(p) values of the main effect of age onto each vertex (WebGL cortical surface rendered on the left, same statistical model as in Figure 2). The two user interface components displayed are the Colormap Editor (bottom right) which controls a step-wise linear colormap and the “Controls” interface (middle right) that provides a selection of main and interaction effects as well as an option to display the predicted values for each vertex over the range of the predictor (age). Further options include surface re-orientation, background color selection, control of the false discovery rate to correct for effects of multiple comparisons, and an option to adjust the geometry as a predicted variable.
Figure 4
Figure 4
Screen capture of the image viewer application. A multi-planar reconstruction displays axial (top left), sagittal (top right), and coronal (middle right) images linked by a common cross-hair (pale yellow). Below, a row of axial thumbnail images depict available image modalities such as (left to right) fused sub-cortical segmentation with T1-weighted anatomical image, fractional anisotropy (FA), mean diffusivity, T1-weighted anatomical image, color coded directional image stack, fused FA and T1 image stack, fused fiber atlas tract with T1 and fiber atlas tract image stack. All image modalities are registered with each other and selection of a thumbnail image will display the corresponding volumetric information in the multi-planar viewer component above the row of thumbnails. All images support slice browsing using the mouse wheel, brightness, and contrast calibration, and image zoom.
Figure 5
Figure 5
Screen capture of a section of the data dictionary displaying NIH toolbox measures. A sequential number is displayed together with the dictionary term on the left side of the page. On the right side, the corresponding axis label (top) and the available long description (bottom) is listed. Links to external resources such as the PhenX toolkit are embedded into the page. This HTML5 encoded document also contains the RDFa structure information to facilitate knowledge extraction.
Figure 6
Figure 6
Screen capture displaying parts of the hierarchical structure of the PING data dictionary. The branches for “Imaging” and “cortical contrast” have been opened by the viewer. The regular expression used to create the displayed hierarchy level for “Imaging” is “/(H_area|H_thickness|H_contrast|H_volume|H_intensity|Diffusion|H_Fuzzy)/”. The entry “cortical contrast” (H_contrast) is implemented by the pattern “/(^MRI_cort_contrast)/”. In PING this maps to all MRI related cortical contrast measures in the data dictionary (subset displayed on the right).
Figure 7
Figure 7
Screen capture of the SNP browser application used to explore and extract genetic information available for the PING study. A search mask is used to specify a gene (SSH, sonic hedgehog). Utilizing a database with 80,000 entries, the SNP browser obtains the available chromosome number (7) and the basepair location (155,592,735–155,601,766) for this gene. The table is filled with SNP entries that fall in the range of the basepair location. In this example, three SNP entries are available. The user has selected SNP number 2 indicated by the dark blue checkbox and the corresponding SNP name has been copied to the list of SNP names for download. Selecting the download option would provide the user with a spreadsheet of the alleles for this SNP for all PING subjects.
Figure 8
Figure 8
Image collage of surface models exported from the surface viewer application for the model described in section 3. Cortical area expansion factor is mapped as color (red—expansion, blue—contraction) over age (3–21 years, left to right) given the model described in section 3. Rows show superior (1), right lateral (2 and 3), medial view of the right hemisphere (4 and 5), medial view of the left hemisphere (6 and 7), left lateral (8 and 9), and inferior (10) views of the 3d surface model.

References

    1. 1000 Genomes. (2012). An Integrated Map of Genetic Variation From 1,092 Human Genomes. 10.1038/nature11632 - DOI - PMC - PubMed
    1. Akaike H. (1974). A new look at the statistical model identification. IEEE Trans. Automat. Contr. 19, 716–723 10.1109/TAC.1974.1100705 - DOI
    1. ASM. (2013). ASM. Availble online at: http://asmjs.org/, Last viewed July 2013.
    1. Benjamini Y., Hochberg Y. (1995). Controlling the false discovery rate: a practical and powerful approach to multiple testing. J. Roy. Statist. Soc. Ser. B 57, 289–300
    1. Biffi A., Anderson C. D., Desikan R. S., Sabuncu M., Cortellini L., Schmansky N., et al. (2010). Genetic variation and neuroimaging measures in alzheimer disease. Arch. Neurol. 67, 677–685 10.1001/archneurol.2010.108 - DOI - PMC - PubMed