. 2014 Apr 10;157(2):357-368.
doi: 10.1016/j.cell.2014.02.053.

Accumulation of dynamic catch bonds between TCR and agonist peptide-MHC triggers T cell signaling

Affiliations

Accumulation of dynamic catch bonds between TCR and agonist peptide-MHC triggers T cell signaling

Baoyu Liu et al. Cell. .

Abstract

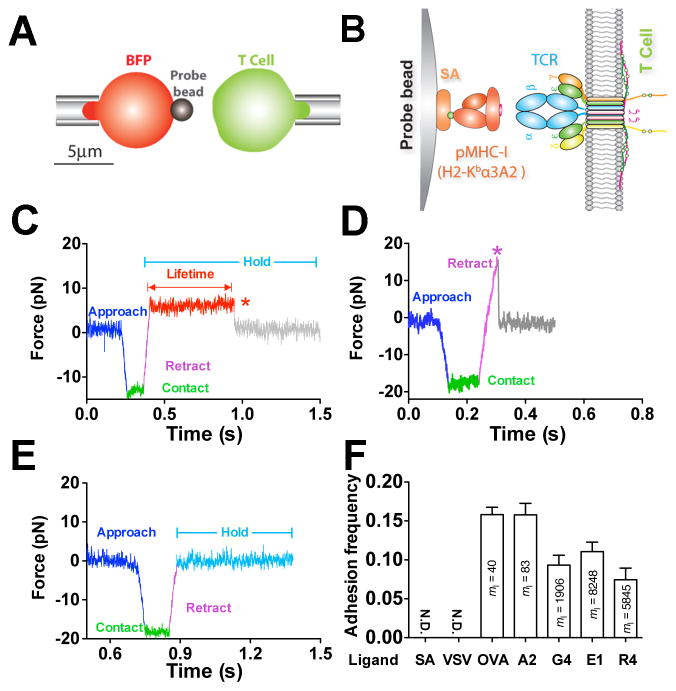
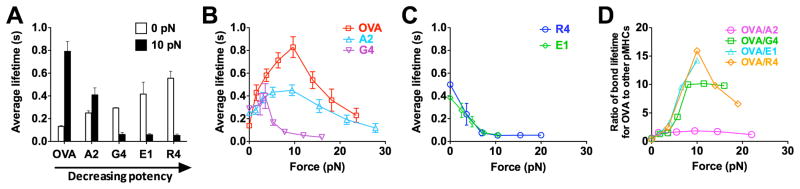
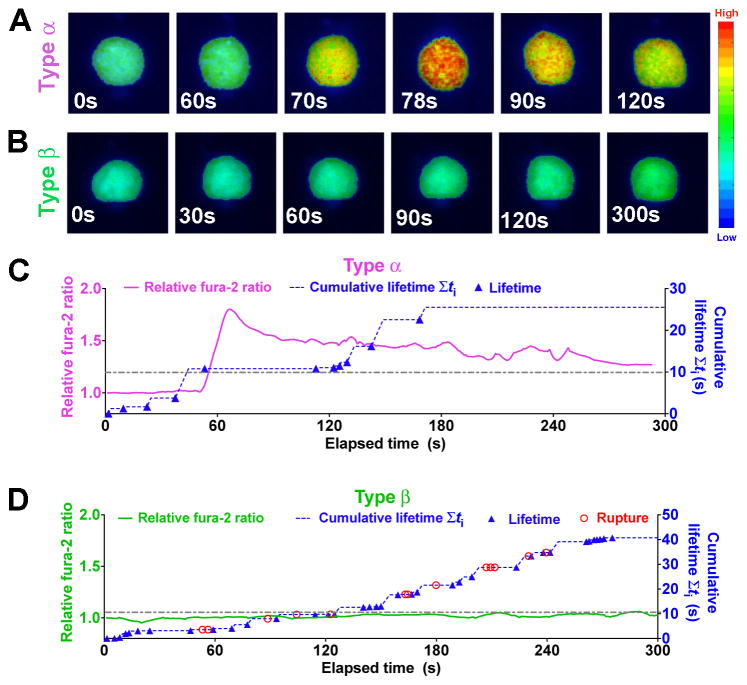
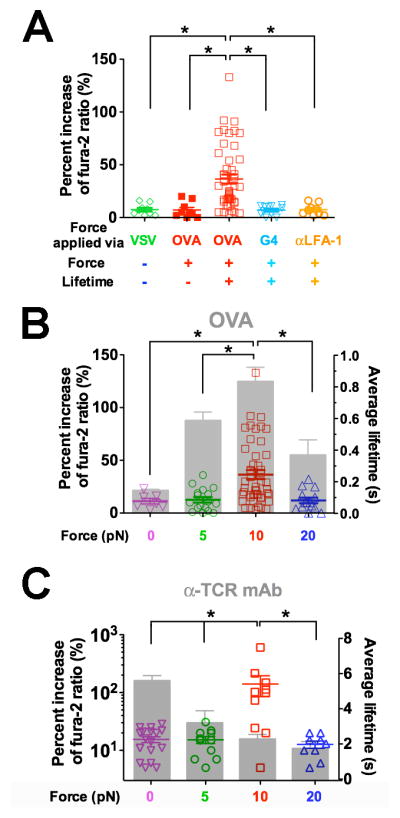
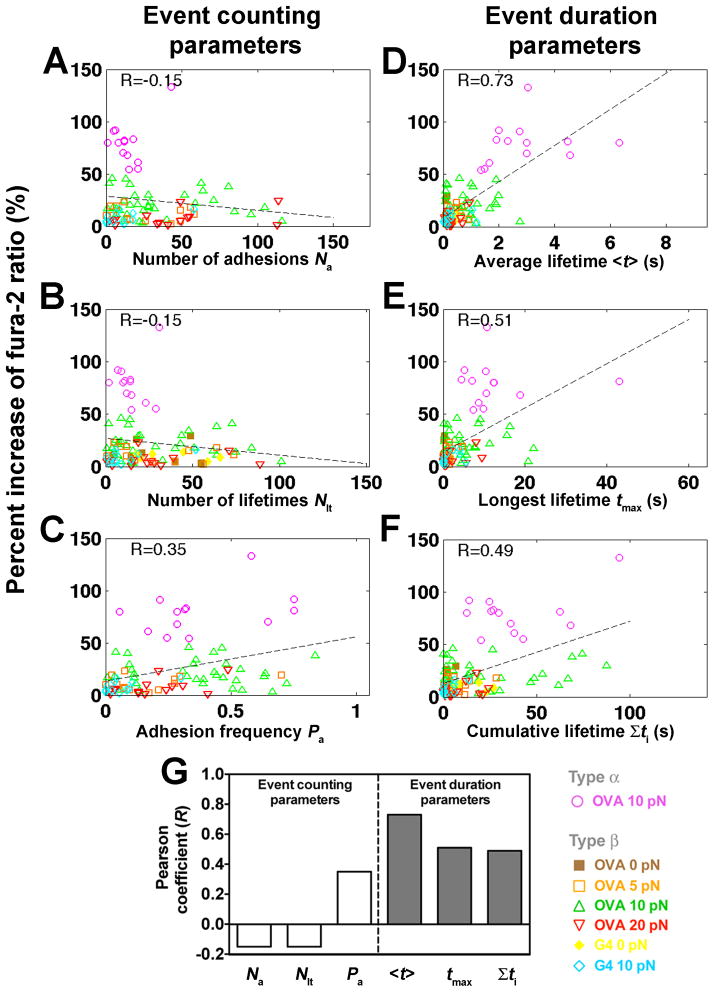
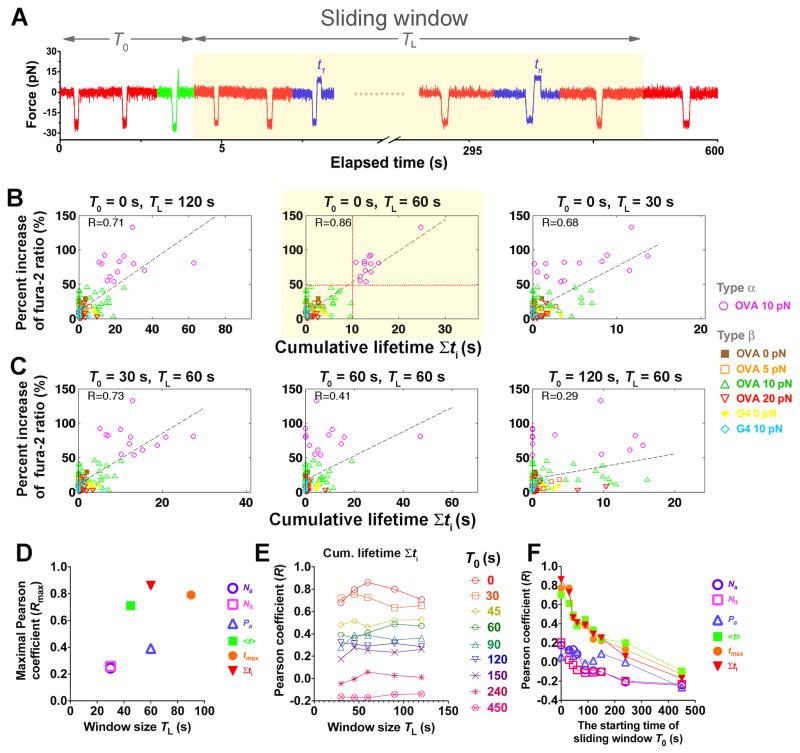
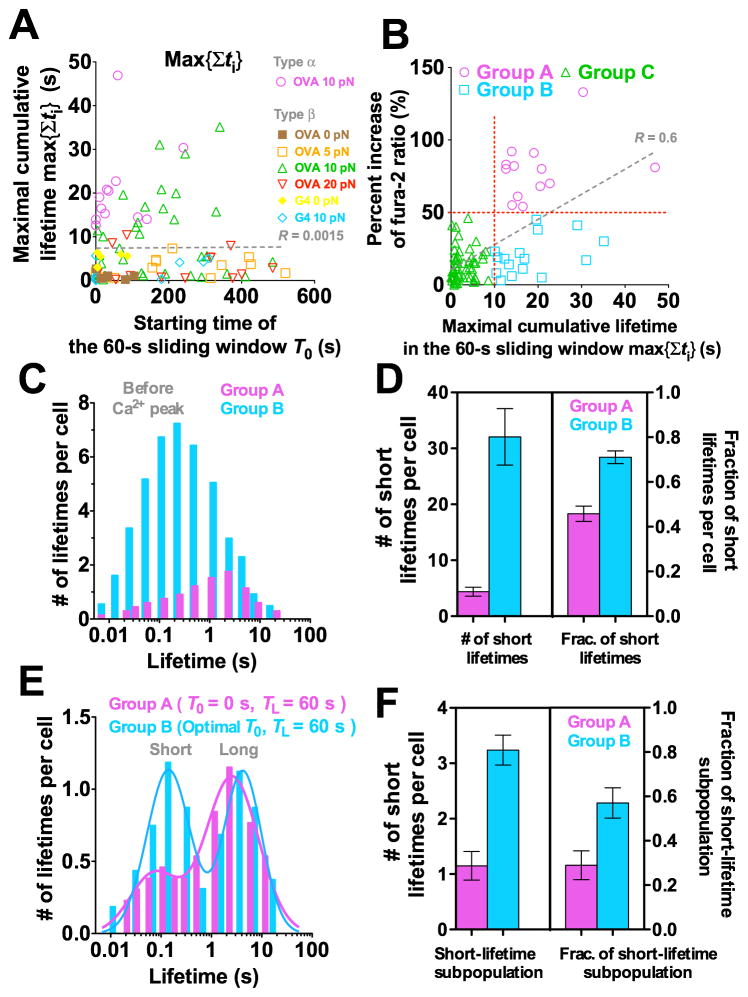
TCR-pMHC interactions initiate adaptive immune responses, but the mechanism of how such interactions under force induce T cell signaling is unclear. We show that force prolongs lifetimes of single TCR-pMHC bonds for agonists (catch bonds) but shortens those for antagonists (slip bonds). Both magnitude and duration of force are important, as the highest Ca(2+) responses were induced by 10 pN via both pMHC catch bonds whose lifetime peaks at this force and anti-TCR slip bonds whose maximum lifetime occurs at 0 pN. High Ca(2+) levels require early and rapid accumulation of bond lifetimes, whereas short-lived bonds that slow early accumulation of lifetimes correspond to low Ca(2+) responses. Our data support a model in which force on the TCR induces signaling events depending on its magnitude, duration, frequency, and timing, such that agonists form catch bonds that trigger the T cell digitally, whereas antagonists form slip bonds that fail to activate.


Figures

Figure 1
Figure 1. In situ analysis of force-dependent TCR–pMHC bond kinetics by BFP
(A) BFP schematic. A micropipette-aspirated RBC with a probe bead attached to the apex (left) was aligned against a T cell held by an apposing pipette (right). (B) BFP functionalization. The probe bead was covalently linked to streptavidin (SA) to capture pMHC (left) to interact with TCR (right). (C–E) Representative force traces of measurement cycles showing adhesion that survived ramping and sustained a preset level of force until dissociation (marked by a red star), enabling bond lifetime measurement (C), adhesion ruptured by a ramp force (marked by a magenta star) before reaching the set force or in force-ramp assay (D), or no adhesion (E). (F) Binding specificity. Mean ± s.e.m. of adhesion frequencies of >10 T-cell–bead pairs with 50 contacts for each. Densities of pMHCs (ml) are indicated inside of each bar. N.D. = not detected. See also Figure S1 and Movie S1–S3.
Figure 2
Figure 2. TCR forms agonist-specific catch-slip bond
(A) Lifetimes of bonds of OT1 T-cells with probe beads coated with indicated pMHCs at 0 (white) and 10 (black) pN. (B and C) Lifetime vs. force curves showing that OT1 TCR formed catch-slip bonds with progressively weaker agonists OVA (red open square), A2 (light blue open triangle), and G4 (inverted magenta open triangle) (B) but slip-only bonds with antagonists R4 (blue open circle) and E1 (green open diamond) (C). (D) Force regulation of antigen discrimination, measured by the average lifetime ratio of TCR bonds with OVA to another peptide. See also Figure S2.
Figure 3
Figure 3. Single-cell concurrent measurement of Ca2+ flux and in situ TCR–pMHC bond kinetics
(A–B) Representative wide-field pseudo-colored images of two types of intracellular Ca2+ signals. (C–D) Representative time courses of relative fura-2 ratio of type α (C, magenta curve, left ordinate) or type β (D, green curve, left ordinate) intracellular Ca2+ signal synchronized with concurrent measurement of rupture (red open circle) and lifetime (blue solid triangle) events and the cumulative lifetime (blue dashed curve, right ordinate). Note that there is no rupture events for Panel (C). A dashed-dot horizontal line indicates a 10-s threshold of cumulative lifetime. See also Figure S3.
Figure 4
Figure 4. TCR- and pMHC-specific Ca2+ flux requires both force and lifetime
(A) Ca2+ flux requires durable force on TCR bond applied by antigen pMHC. Percent increase of fura-2 ratio in OT1 T cells tested without force or lifetime via VSV (green open diamond, cf. Figure 1E), with force but no lifetime via OVA (red solid square, cf. Figure 1D), or with both force and lifetime (cf. Figure 1C) via OVA (red open square) or G4 (inverted light blue open triangle) or via anti-LFA-1 beads (orange open circle). (B–C) Ca2+ was triggered by an optimal force. Percent increase of fura-2 ratio (points, left ordinate) in OT1 T cells triggered by lifetimes (grey bars, mean ± s.e.m. of >50 measurements, right ordinate) of TCR bonds with OVA (B) or anti-OT1 (C) measured at 0 (inverted magenta open triangle), 5 (green open circle), 10 (red open square), or 20 (blue open triangle) pN force. * denotes p < 0.01 on Ca2+ signals.
Figure 5
Figure 5. Correlating Ca2+ signals with kinetic-associated statistics from each cell’s 600-s event sequence
(A–F) Percent increase of fura-2 ratios vs. number of adhesions Na (A), number of lifetimes Nlt (B), adhesion frequency Pa (C), average lifetime <t> (D), longest lifetime tmax (E), and cumulative lifetime Σti (F) of OT1 TCR bonds with OVA at 0 (brown solid square), 5 (orange open square), 10 (magenta open circle or green open triangle, for type α or β Ca2+, respectively) or 20 (inverted open red triangle) pN, or with G4 at 0 (yellow solid diamond) or 10 (light blue open diamond) pN for each T-cell calculated from the binding events in the entire 10-min experimental period. Dashed lines are linear fits to data. The Pearson coefficient of the correlation (R) is indicated in each subpanel. (G) Summary of Pearson coefficients.
Figure 6
Figure 6. Ca2+ best correlates with TCR–pMHC bond lifetimes accumulated in the first minute of successive force applications
(A) Schematic of a sliding window (highlighted), starting at T0 with length TL and containing different binding events (red: no adhesion; green: rupture force; blue: lifetime). (B and C) Percent increase of fura-2 ratio vs. cumulative lifetime of OT1 TCR bonds with OVA at 0 (brown solid square), 5 (orange open square), 10 (magenta open circle or green open triangle, for type α or β, respectively) or 20 (inverted open red triangle) pN, or with G4 at 0 (yellow solid diamond) or 10 (light blue open diamond) pN for each T cell accumulated in windows of indicated lengths and starting times. Dashed lines are linear fits to data and the Pearson coefficients (R) are indicated. The horizontal and vertical dotted lines in the subpanel with the best correlation (highlighted) denote the demarcation of types α (magenta open circle) and β (brown solid square, orange open square, green open triangle, inverted open red triangle, yellow solid diamond, light blue open diamond) Ca2+ and the 10-s threshold of cumulative lifetime for triggering type α Ca2+. (D–F) Pearson coefficient analysis to search for the window for the kinetic parameters to achieve the best correlation with Ca2+. (D) Maximal Pearson coefficients Rmax vs. TL of the initial window (T0 = 0) within which the kinetic parameters best correlate with Ca2+. (E) Pearson coefficient for cumulative lifetime vs. sliding window size TL for the indicated starting times T0. (F) Pearson coefficients for indicated kinetic parameters calculated in a 60-s sliding window vs. its starting time T0. Different symbols in (D and F) denote number of adhesions Na (purple open circle), number of lifetimes Nlt (magenta open square), adhesion frequency Pa (blue open triangle), average lifetime <t> (green solid square), longest lifetime tmax (orange solid circle), and cumulative lifetime Σti (inversted red solid triangle).
Figure 7
Figure 7. Long TCR–pMHC bond lifetime accumulated after many short ones fails to induce Ca2+
(A) Maximal cumulative lifetime max{Σti} of TCR bonds with OVA at 0 (brown solid square), 5 (orange open square), 10 (magenta open circle or green open triangle, for type α or β Ca2+, respectively) or 20 (inverted red open triangle) pN, or with G4 at 0 (yellow solid diamond) or 10 pN (light blue open diamond) for each T cell accumulated in a 60-s window vs. its starting time T0. (B) Percent increase of fura-2 ratio vs. maximal cumulative lifetime max{Σti} calculated for each cell in its own 60-s window with starting time adjusted to allow Σti to achieve maximum. Demarcation of 50% increase of fura-2 ratio and threshold of 10-s cumulative lifetime (horizontal and vertical red dotted lines) are used to segregate cells into three groups. Group A cells accumulated >10 s lifetime in the initial 60-s window and generated type α Ca2+ (magenta open circle). Group B cells accumulated >10 s lifetime in later 60-s windows but generated type β Ca2+ (light blue open square). Group C cells accumulated <10 s lifetime and generated type β Ca2+ (green open triangle). Dashed lines in (A and B) are linear fits to data with R-values indicated. (C–F) Normalized lifetime histogram (C and E) and number (left ordinate) and fraction (right ordinate) of short lifetimes (D and F) before Ca2+ peak pooled from cells in groups A (magenta) and B (cyan). (E and F) are similar to (C and D) except that lifetimes were collected from an initial 60-s window for group A; but for group B the starting time was adjusted for each cell to allow Σti to achieve maximum.

References

    1. Adams Jarrett J, Narayanan S, Liu B, Birnbaum Michael E, Kruse Andrew C, Bowerman Natalie A, Chen W, Levin Aron M, Connolly Janet M, Zhu C, et al. T Cell Receptor Signaling Is Limited by Docking Geometry to Peptide-Major Histocompatibility Complex. Immunity. 2011;35:681–693. - PMC - PubMed
    1. Alam SM, Travers PJ, Wung JL, Nasholds W, Redpath S, Jameson SC, Gascoigne NRJ. T-cell-receptor affinity and thymocyte positive selection. Nature. 1996;381:616–620. - PubMed
    1. Aleksic M, Dushek O, Zhang H, Shenderov E, Chen JL, Cerundolo V, Coombs D, van der Merwe PA. Dependence of T Cell Antigen Recognition on T Cell Receptor-Peptide MHC Confinement Time. Immunity. 2010;32:163–174. - PMC - PubMed
    1. Altan-Bonnet G, Germain RN. Modeling T cell antigen discrimination based on feedback control of digital ERK responses. PLoS Biol. 2005;3:e356. - PMC - PubMed
    1. Chen W, Evans EA, McEver RP, Zhu C. Monitoring Receptor-Ligand Interactions between Surfaces by Thermal Fluctuations. Biophys J. 2008a;94:694–701. - PMC - PubMed

Publication types