. 2014 Apr 10;157(2):420-432.
doi: 10.1016/j.cell.2014.02.018.

Asymmetric friction of nonmotor MAPs can lead to their directional motion in active microtubule networks

Affiliations

Asymmetric friction of nonmotor MAPs can lead to their directional motion in active microtubule networks

Scott Forth et al. Cell. .

Abstract

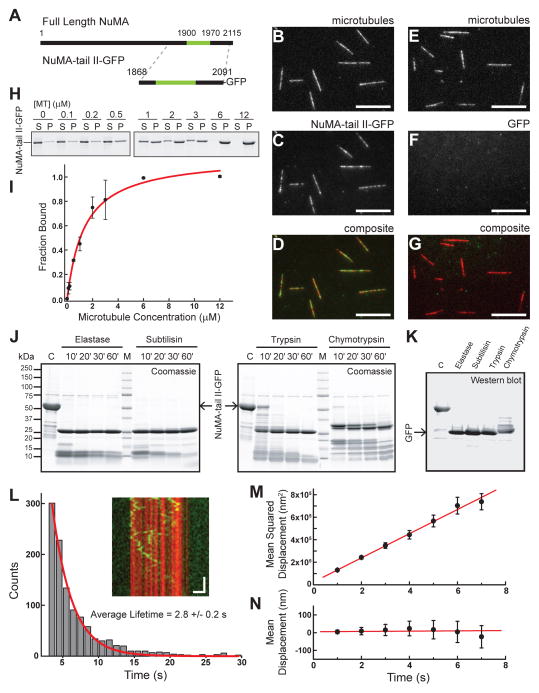
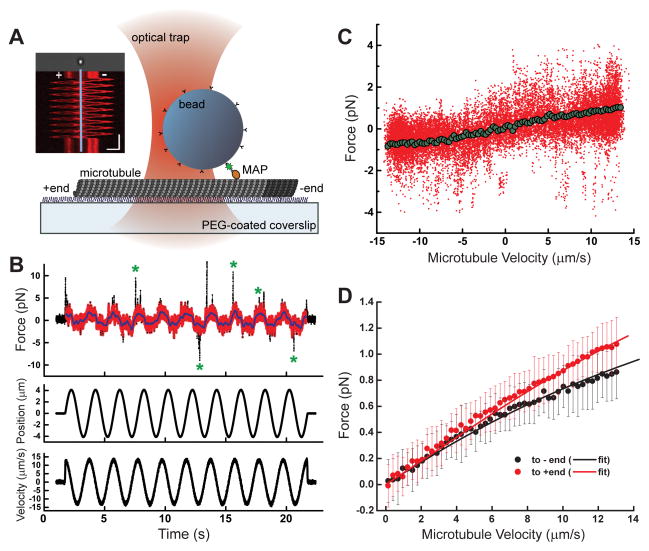
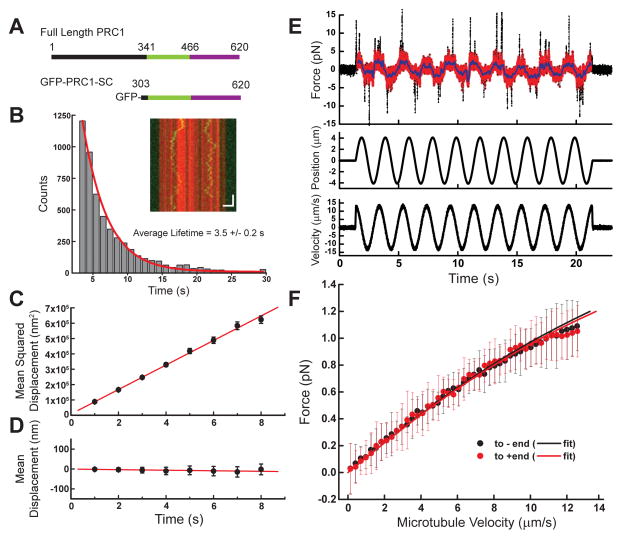
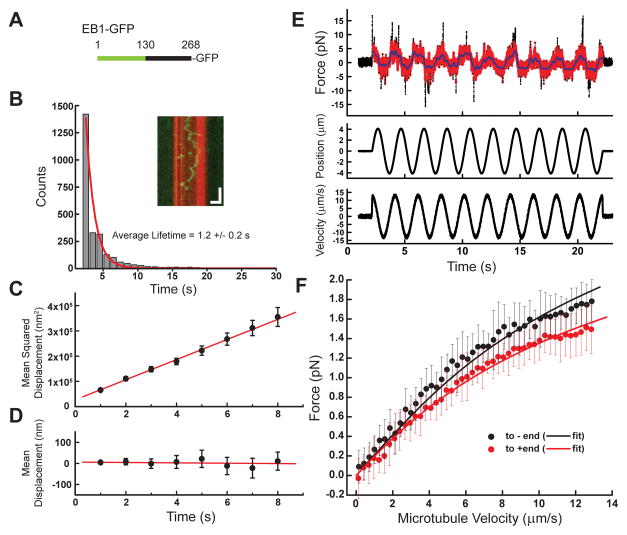
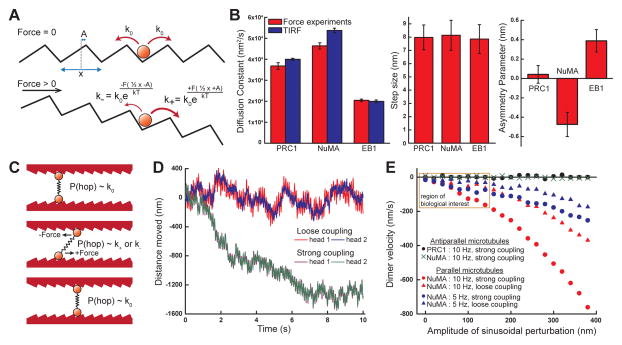
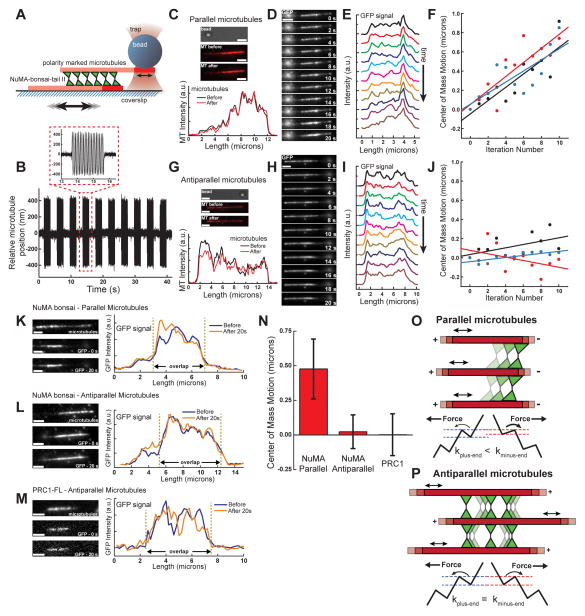
Diverse cellular processes require microtubules to be organized into distinct structures, such as asters or bundles. Within these dynamic motifs, microtubule-associated proteins (MAPs) are frequently under load, but how force modulates these proteins' function is poorly understood. Here, we combine optical trapping with TIRF-based microscopy to measure the force dependence of microtubule interaction for three nonmotor MAPs (NuMA, PRC1, and EB1) required for cell division. We find that frictional forces increase nonlinearly with MAP velocity across microtubules and depend on filament polarity, with NuMA's friction being lower when moving toward minus ends, EB1's lower toward plus ends, and PRC1's exhibiting no directional preference. Mathematical models predict, and experiments confirm, that MAPs with asymmetric friction can move directionally within actively moving microtubule pairs they crosslink. Our findings reveal how nonmotor MAPs can generate frictional resistance in dynamic cytoskeletal networks via micromechanical adaptations whose anisotropy may be optimized for MAP localization and function within cellular structures.


Figures

Figure 1
Figure 1
Characterizations of NuMA’s microtubule binding. (A) Schematic depicting full-length NuMA and the truncated NuMA-tail II-GFP used in this study. The microtubule binding domain is highlighted in green (aa: 1900–1970). (B–D) NuMA-tail II-GFP (2 nM, green) binds surface-attached microtubules (red), as visualized via TIRF microscopy (B, microtubules; C, NuMA-tail II-GFP; D, composite). (E–G) GFP alone (2 nM) shows no microtubule localization (Scale bars = 10 μm). (H) Western blot-based analysis (anti-GFP) of NuMA-tail II-GFP’s microtubule binding. NuMA-tail II-GFP concentration was 1 μM. (I) Band intensities from (H) were used to determine fraction of protein bound, and were plotted against microtubule concentration; data were fit to the Hill equation (binding affinity Kd = 1.2 ± 0.2 μM; Hill coefficient = 1.2 ± 0.1 (N = 3 independent experiments). (J) SDS-PAGE analysis of limited proteolysis reactions performed on NuMA-tail II-GFP with four unique proteases reveals multiple low-molecular weight digestion products. (K) The persistent bands at 26 kDa in the gels shown in (J) were confirmed to be GFP by Western blot. (L) Diffusion of NuMA-tail II-GFP on the microtubule lattice plotted as a kymograph (inset: microtubule, red; NuMA-tail II-GFP, green. Vertical scale bar = 5 s, Horizontal scale bar = 2 μm). Histogram of binding lifetimes is fit to a single exponential Ae-tτ(characteristic lifetime τ = 2.8 ± 0.2 s, N = 4 independent experiments, n = 1984 single particles). (M) The mean squared displacement of single molecule diffusion events is calculated for NuMA-tail II-GFP (n = 136 traces from N = 4 independent experiments). Fitting MSD = 2Dt + offset yields the diffusion constant, D = 53,700 ± 1,000 nm2/s. (N) Mean displacement analysis of the same diffusion events from (M) are fit to a linear relationship (slope = 0.8 ± 1.6 nm/s).
Figure 2
Figure 2
Microtubule binding of NuMA under load. (A) Schematic of the optical trapping assay. A bead sparsely coated with NuMA-tail II-GFP is held above a polarity-marked microtubule, which is oscillated via a piezoelectric stage. Inset: kymograph depicts a representative time course of a polarity-marked microtubule’s motion (Scale bars: vertical = 5 s, horizontal = 4 μm). (B) Raw time series data for a single bead/microtubule pair is shown: force (raw data, black; processed data, red), microtubule position, and velocity are simultaneously recorded during 10 periods of oscillation. Green asterisks mark examples of transient force spikes. (C) Force data from (B) is plotted as a function of velocity (raw data, red; binned and averaged data, green). (D) The average force/velocity relationship for ~250 oscillation cycles taken with N = 15 bead/microtubule pairs is shown, with data parsed by dragging direction (black points = towards minus-end, red points = towards plus-end, error bars = SD). Black and red lines are from a fit using the model described in Figure 5 (R2 = 0.9962).
Figure 3
Figure 3
Microtubule binding of PRC1 under load. (A) Schematic depicting full-length PRC1 and the monomeric GFP-PRC1-SC used for single molecule analysis. The microtubule binding regions are highlighted: spectrin domain (green) and unstructured tail (purple). (B) Diffusion of PRC1-SC on microtubules (inset: microtubule, red; GFP-PRC1-SC, green. Scale bars: vertical = 5 s, horizontal = 2 μm). Histogram of binding lifetime is fit to a single exponential Ae-tτ (characteristic lifetime τ = 3.5 ± 0.2 s, N = 5 independent experiments, n = 7655 single particles). (C) The mean squared displacement of single molecule diffusion events is calculated for GFP-PRC1-SC (n = 233 traces from N = 5 independent experiments. Diffusion constant, D = 39,900 ± 500 nm2/s). (D) Mean displacement analysis of the same diffusion events from (C) are fit to a linear relationship (slope = −1.3 ± 0.4 nm/s). (E) Raw time series data for a single bead/microtubule pair: force (raw data, black; processed data, red), microtubule position, and microtubule velocity are shown. (F) The average force/velocity relationship for ~150 oscillation cycles taken with N = 9 bead/microtubule pairs (black points = towards minus-end, red points = towards plus-end, error bars = SD). Black and red lines are model fits (R2 = 0.9983).
Figure 4
Figure 4
Microtubule binding of EB1 under load. (A) Schematic depicting full length EB1-GFP construct used in this study. The calponin homology domain (aa:1–130) is highlighted (green). (B) Diffusion of EB1 on the microtubule lattice (inset: microtubule, red; EB1-GFP, green. Scale bars: vertical = 5 s, horizontal = 2 μm). Histogram of binding lifetime is fit to a single exponential Ae-tτ (characteristic lifetime τ = 1.2 ± 0.2 s, N = 4 independent experiments, n = 2626 single particles). (C) The mean squared displacement of single molecule diffusion events is calculated for EB1-GFP (n = 144 traces from N = 4 independent experiments. Diffusion constant, D = 19,900 ± 500 nm2/s. (D) Mean displacement analysis of the same diffusion events from (C) are fit to a linear relationship (slope = −0.9 ± 1.4 nm/s). (E) Raw time series data for a single bead/microtubule pair: force (raw data, black; processed data, red), microtubule position, and microtubule velocity are shown. (F) The average force/velocity relationship for ~180 oscillation cycles taken with N = 11 bead/microtubule pairs (black points = towards minus-end, red points = towards plus-end, error bars = SD). Black and red lines are model fits (R2 = 0.9946).
Figure 5
Figure 5
Quantitative analyses of MAP-microtubule interactions under load. (A) A model depicting the modulation of the rate of diffusion both unloaded and under force. (B) Fits to the force-velocity relationships for all three proteins yield the diffusion constant D (red, force experiments; blue, TIRF imaging), step size between microtubule binding sites x, and asymmetry parameter A. (C) A schematic depicting the behavior of a dimerized microtubule crosslinker with mechanical properties calculated from (B). (D) Time courses of two simulations for dimerized crosslinking MAPs with asymmetric friction under periodic agitation (amplitude = 100nm, frequency = 10 Hz). Stronger coupling between the two microtubule binding domains yields faster directional motion. (E) Calculated dimer velocity as a function of amplitude of perturbation, for different coupling strengths, asymmetry values, and perturbation rates. Using parameters measured for NuMA, a frictionally asymmetric dimer exhibits minus-end directed motion under agitation of two parallel microtubules. A frictionally symmetric dimer (e.g., using PRC1’s measured parameters) or a frictionally asymmetric dimer crosslinking antiparallel microtubules (e.g., NuMA) exhibit no directional motion. (N = 100 independent simulation results per data point; region of primary biological interest at smaller amplitudes is highlighted).
Figure 6
Figure 6
NuMA-bonsai-tail II-GFP is a dimer that can crosslink two microtubules. (A) Schematic depicting NuMA constructs (dimerization domain, blue; microtubule binding domain, green). (B) Gel filtration profiles for both NuMA-NTD (black) and NuMA-bonsai-tail II (red). Void (V0) and peak volumes indicated. (C) SDS-PAGE gel and a Western blot against GFP in gels run with NuMA-bonsai-tail II-GFP. (D) Sample time courses of fluorescence photo-bleaching shows multiple intensity steps. Traces are offset for clarity. (E–G) Microtubule bundles formed with NuMA-bonsai. Microtubules (E), NuMA-bonsai-tail II-GFP (F), composite (G) are shown (scale bars = 5 μm). (H) Linescans of the bundle highlighted in (G). (I) Comparison of microtubule and GFP intensity between single microtubule and overlap regions for bundles formed with NuMA-bonsai-tail II-GFP (N=17 pairs). (J–L) Localization of NuMA-bonsai-tail II-GFP at the poles of metaphase spindles assembled in Xenopus egg extract. Microtubules (J), GFP signal (K), and composite (L) images are presented (scale bars = 10 μm). (M) Diffusion of NuMA-bonsai-tail II-GFP on the microtubule lattice (inset: microtubule, red; NuMA-bonsai-tail II-GFP, green. Vertical scale bar = 5 s, Horizontal scale bar = 2 μm). Histogram of binding lifetime is fit to a single exponential Ae-tτ (characteristic lifetime τ = 3.6 ± 0.2 s, N = 3 independent experiments, n = 3929 single particles). (N) The mean squared displacement of single molecule diffusion events is calculated for NuMA-tail II-GFP (n = 94 traces from N = 3 independent experiments. Diffusion constant, D = 26,000 ± 1,200 nm2/s. (O) Mean displacement analysis of the diffusion events from (N) are fit to a linear relationship (slope = −0.6 ± 0.9 nm/s). (P) Diffusion of NuMA-bonsai-tail II-GFP in microtubule bundle (inset: microtubule, red; NuMA-bonsai-tail II-GFP, green. Vertical scale bar =20 s, Horizontal scale bar = 2 μm). Histogram of binding lifetimes is fit to double exponential A1e-tτ1+A2e-tτ21=4.7 ± 0.2 s, τ2=28.4 ± 2.1 s, N = 3 independent experiments).
Figure 7
Figure 7
Frictional asymmetry can give rise to directional motion of non-motor MAPs in dynamic microtubule arrays. (A) Schematic of the optical trapping assay. (B) Time course of microtubule relative motion. The microtubules are oscillated for 2 seconds, followed by a 2 second pause for imaging. (C) Images of the bead and microtubules, and intensity linescans before and after perturbations are shown for a parallel microtubule ‘sandwich.’ (D) Time course of GFP fluorescence images taken after each microtubule oscillation event. (E) Linescans of GFP intensity from images shown in (D). (F) ‘Center-of-mass’ positions of fluorescence signals taken for 3 parallel microtubule pairs. (G) Images of the bead and microtubules, and intensity linescans before and after perturbations are shown for an antiparallel microtubule ‘sandwich.’ (H) Time course of GFP fluorescence images taken after each microtubule oscillation event. (I) Linescans of GFP intensity from images shown in (H). (J) ‘Center-of-mass’ positions of fluorescence signals taken for 3 antiparallel microtubule pairs. Scale bars = 2 μm. (K–M) Microtubule image, GFP images before and after perturbations, and linescans of GFP intensities for (K) parallel microtubules crosslinked by NuMA-bonsai-tail II-GFP, (L) antiparallel microtubules crosslinked by NuMA-bonsai-tail II-GFP, and (M) antiparallel microtubules crosslinked by PRC1. Scale bars = 2 μm. (N) Change in position of the center of mass of GFP fluorescence after 20 seconds of perturbations at 10 Hz (NuMA, Parallel: N=10; NuMA, Antiparallel: N=9; PRC1, Antiparallel: N=10). (O) MAPs with asymmetric friction would cluster towards microtubule minus-ends in asters. A schematic of the energy landscape under force shows how rates of MAP motion differ with respect to filament polarity. (P) MAPs with asymmetric friction would remain evenly distributed in antiparallel microtubule bundles. A schematic of the energy landscape under force shows how rates of MAP motion remain the same with respect to filament polarity.

Comment in

References

    1. Bieling P, Laan L, Schek H, Munteanu EL, Sandblad L, Dogterom M, Brunner D, Surrey T. Reconstitution of a microtubule plus-end tracking system in vitro. Nature. 2007;450:1100–1105. - PubMed
    1. Bieling P, Telley IA, Surrey T. A Minimal Midzone Protein Module Controls Formation and Length of Antiparallel Microtubule Overlaps. Cell. 2010;142:420–432. - PubMed
    1. Bormuth V, Varga V, Howard J, Schaffer E. Protein Friction Limits Diffusive and Directed Movements of Kinesin Motors on Microtubules. Science. 2009;325:870–873. - PubMed
    1. Braun M, Lansky Z, Fink G, Ruhnow F, Diez S, Janson ME. Adaptive braking by Ase1 prevents overlapping microtubules from sliding completely apart. Nat Cell Biol. 2011;13:1259–U1201. - PubMed
    1. Buey RM, Mohan R, Leslie K, Walzthoeni T, Missimer JH, Menzel A, Bjelic S, Bargsten K, Grigoriev I, Smal I, et al. Insights into EB1 structure and the role of its C-terminal domain for discriminating microtubule tips from the lattice. Mol Biol Cell. 2011;22:2912–2923. - PMC - PubMed

Publication types

MeSH terms