. 2014 Apr 10;157(2):499-513.
doi: 10.1016/j.cell.2014.03.031.

Global analyses of human immune variation reveal baseline predictors of postvaccination responses

Collaborators, Affiliations

Global analyses of human immune variation reveal baseline predictors of postvaccination responses

John S Tsang et al. Cell. .

Erratum in

  • Cell. 2014 Jul 3;158(1):226

Abstract

A major goal of systems biology is the development of models that accurately predict responses to perturbation. Constructing such models requires the collection of dense measurements of system states, yet transformation of data into predictive constructs remains a challenge. To begin to model human immunity, we analyzed immune parameters in depth both at baseline and in response to influenza vaccination. Peripheral blood mononuclear cell transcriptomes, serum titers, cell subpopulation frequencies, and B cell responses were assessed in 63 individuals before and after vaccination and were used to develop a systematic framework to dissect inter- and intra-individual variation and build predictive models of postvaccination antibody responses. Strikingly, independent of age and pre-existing antibody titers, accurate models could be constructed using pre-perturbation cell populations alone, which were validated using independent baseline time points. Most of the parameters contributing to prediction delineated temporally stable baseline differences across individuals, raising the prospect of immune monitoring before intervention.


Figures

Figure 1
Figure 1. Study design
(A) Study design indicating blood collections and assays performed. Each subject was vaccinated with the seasonal and pandemic H1N1 influenza vaccines right after the day 0 blood draw.
Figure 2
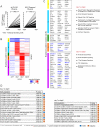
Figure 2. Inter- and intra-subject variation at baseline
(A) Variation in cell population frequencies at baseline. The length of the bar denotes observed sum-of-squares (R2). Blue and grey designate R2 attributed to inter- and intra-subject variation, respectively. (B) Variation in gene expression at baseline. Hierarchical-clustered heatmap of the 500 most variable genes and the relative proportion of inter- and intra-subject variation (see Methods). (C) Clustered heatmaps of genes from two variable immune relevant pathways showing distinct patterns of expression heterogeneity across subjects (see Figure S2C and Methods).
Figure 3
Figure 3. Post-vaccination changes in serologic, cellular and transcriptomic parameters
(A) Increased antigen-specific antibody secreting cells on day 7 following vaccination measured by ELISpot. (B) Heatmap of genes from days -7, 1, 7 and 70 that changed significantly compared to day 0 (FDR<0.05 and absolute log-fold-change > 0.2; fold-change from day 0 is indicated by color). Genes with similar patterns of change were grouped by clustering analysis (indicated by the color bars on the left.) (C) Coherently changed genes in the clusters from B. Right: Representative immunological pathways enriched in coherently changing genes on days 1 and 7 (see Methods). (D) Coherently-changed cell populations on days 1 and 7 post-vaccination (FDR<0.05 and >10% change from day 0). Blue and brown boxes denote populations considered “innate” and “adaptive”, respectively.
Figure 4
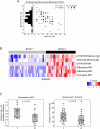
Figure 4. Post-vaccination responses depend on baseline serology and memory B-cell status
(A) Relationship between initial and fold-change (day 70/day 0) in titer for A/Uruguay after vaccination (see Figure S4 for other viruses). Histogram at left shows distribution of the titer responses. (B) Heatmap showing two distinct groups of subjects identified based on robust clustering analysis of day 0 serologic and memory B-cell variables (see Methods) (C) Post-vaccination changes in plasmablast frequencies on day 7 for the low (1) and high (2) initial titer groups from B.
Figure 5
Figure 5. Predictive modeling of antibody response and identification of correlates
(A) Conceptual framework for analyzing contributors to titer response variation following vaccination. Variation in intrinsic factors (purple) can contribute to variations in baseline immune statuses (day 0, marked in blue) and post-vaccination responses (days 1 and 7, marked in green and orange). Baseline variation can in turn contribute to response variation, and all sources of variation can together contribute to variation in titer responses. Contributions to titer variation were analyzed following the “flow” of time (right panel): the contributions of intrinsic variables are first analyzed and their effects are then removed from baseline (day 0) and response (days 1 and 7) parameters, which were then analyzed in a similar step-wise manner (see Methods). (B) ANOVA modeling of day 70 titer response using age, gender, ethnicity, and baseline titers. Fraction of variance explained by each variable and the associated p-values are shown for MFC and adjMFC. (C) Robust transcriptomic correlates from days 1 and 7 post-vaccination (shown as pathway enrichments) (see Methods). Percentage of times a pathway is enriched (p<0.05) is shown. Pathways significant for more than 80% of the trials for at least one time-point are shown. (D) Prediction performance for MFC and adjMFC shown for models built using different number of top cell-populations (D) and genes (F) from day 7 (see Methods). (E) Day 7 predictive cell populations (see Results and Methods). The percentage of times (from 5000 random trials) a cell population is included in the model is shown. Median normalized weights of each population are shown on the right. The sign of the weight indicates the direction of correlation between the cell population and the titer endpoint.
Figure 6
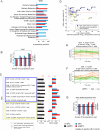
Figure 6. Day 0 predictors and correlates
(A) Robust correlates between day 0 gene expression and response titers (see Figure 5C). (B) Prediction performance using day 0 populations (as in Figure 5D). (C) Day 0 predictive cell populations analyzed as in Figure 5E. (D) Scatter plot of intra-subject stability (y) vs. inter-subject variance (x) (see Methods). Predictive populations from (C) are highlighted in blue (more stable populations) and yellow (less stable). (E-F) Temporal profiles of two stable predictive cell populations for high (orange) and low (green) responders (based on adjMFC). Missing data points correspond to samples with low viability. (G) Predictive performance for day 0 using only the temporally stable populations (those above the 80% mark in Figure 6D).
Figure 7
Figure 7. Gene expression and pathway enrichment signatures of predictive cell populations
Genes significantly correlated with predictive populations from (A) day 0 and (B) day 7. In (B), coherently changing genes from Figure 3 are highlighted by color denoting the clusters from Figure 3B. Analyses were performed separately for positively and negatively correlated genes (in red and blue scales respectively). Only genes significantly correlated with at least one population are shown (FDR<0.01). Pathway enrichment analyses of gene correlates of (C) day 0 and (D) day 7 predictive cell populations (from Figure 6C).

References

    1. Benjamini Y, Hochberg Y. Controlling the False Discovery Rate: A Practical and Powerful Approach to Multiple Testing. Journal of the Royal Statistical Society Series B (Methodological) 1995;57:289–300.
    1. Biancotto A, Fuchs JC, Williams A, Dagur PK, McCoy JP., Jr. High dimensional flow cytometry for comprehensive leukocyte immunophenotyping (CLIP) in translational research. Journal of immunological methods. 2011;363:245–261. - PMC - PubMed
    1. Brandes M, K.F., Kuchen S, Germain RN. A Top-down Systems Analysis Identifies an Innate Feed-forward Inflammatory Circuit Leading to Lethal Influenza Infection. Cell. 2013 in press. - PMC - PubMed
    1. Bucasas KL, Franco LM, Shaw CA, Bray MS, Wells JM, Nino D, Arden N, Quarles JM, Couch RB, Belmont JW. Early patterns of gene expression correlate with the humoral immune response to influenza vaccination in humans. The Journal of infectious diseases. 2011;203:921–929. - PMC - PubMed
    1. Chuang HY, Hofree M, Ideker T. A decade of systems biology. Annual review of cell and developmental biology. 2010;26:721–744. - PMC - PubMed

Publication types

Substances