. 2014 May;29(5):252-9.
doi: 10.1016/j.tree.2014.03.006. Epub 2014 Apr 11.

The others: our biased perspective of eukaryotic genomes

Affiliations

The others: our biased perspective of eukaryotic genomes

Javier del Campo et al. Trends Ecol Evol. 2014 May.

Abstract

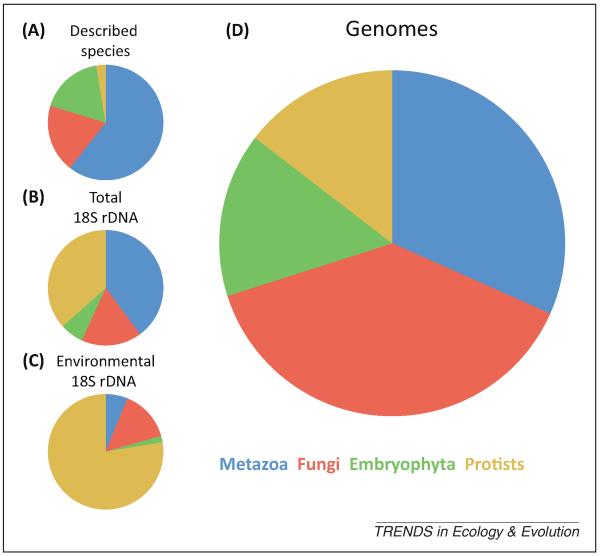
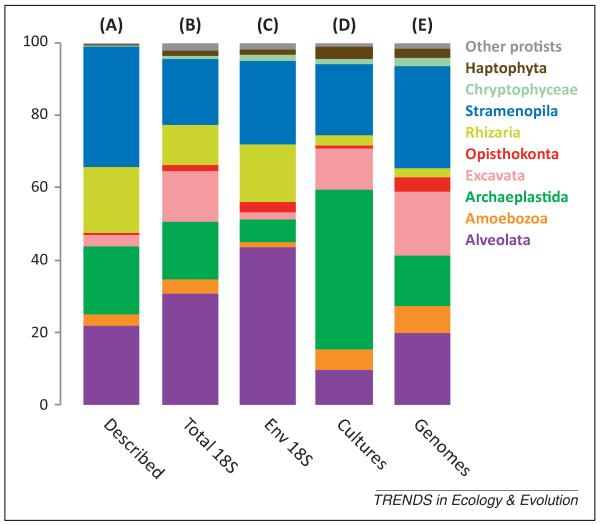
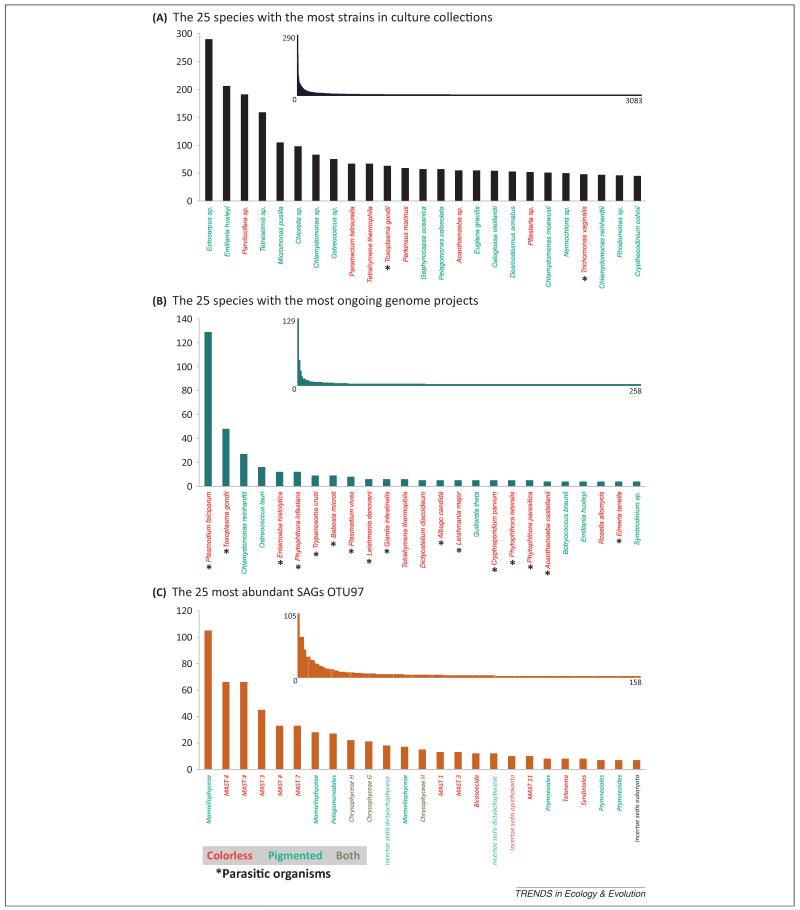
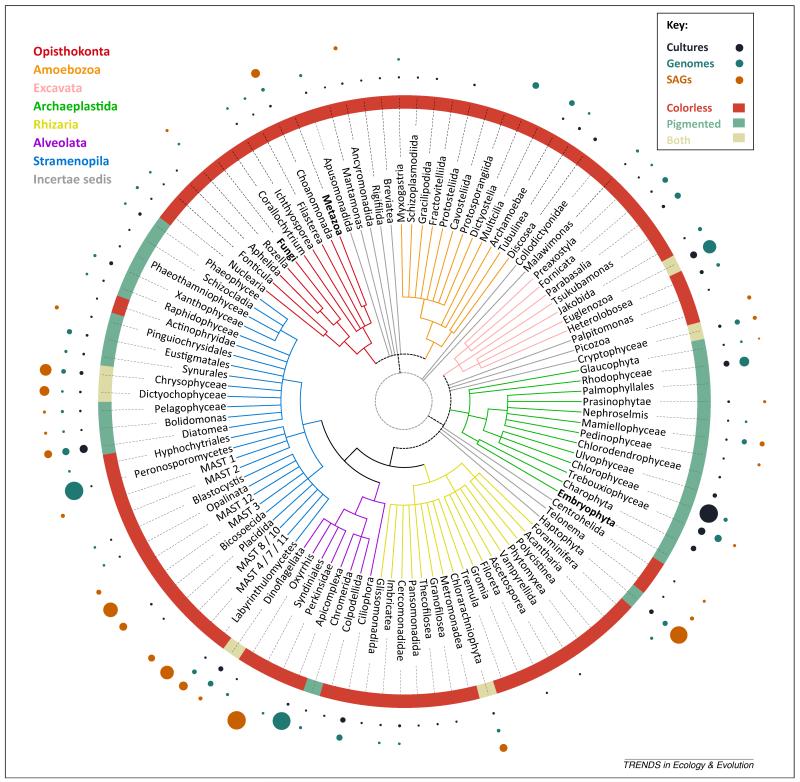
Understanding the origin and evolution of the eukaryotic cell and the full diversity of eukaryotes is relevant to many biological disciplines. However, our current understanding of eukaryotic genomes is extremely biased, leading to a skewed view of eukaryotic biology. We argue that a phylogeny-driven initiative to cover the full eukaryotic diversity is needed to overcome this bias. We encourage the community: (i) to sequence a representative of the neglected groups available at public culture collections, (ii) to increase our culturing efforts, and (iii) to embrace single cell genomics to access organisms refractory to propagation in culture. We hope that the community will welcome this proposal, explore the approaches suggested, and join efforts to sequence the full diversity of eukaryotes.

Keywords: culture collections; culturing bias; ecology; eukaryotic genomics; eukaryotic tree of life; phylogeny; single cell genomics.


Figures

Figure 1
Figure 1
Relative representation of metazoans, fungi, and land plants versus all the other eukaryotes in different databases. (A) Relative numbers of described species according to the CBOL ProWG (n = 2 001 573). (B) Relative numbers of 18S rDNA OTU97 in GenBank (n = 22 475). (C) Relative number of environmental 18S rDNA OTU97 in GenBank (n = 1165). (D) Relative number of species with a genome project completed or in progress according to GOLD, per eukaryotic group (n = 1758). Data in panels A–C are from [8]. Abbreviations: CBOL ProWG, Consortium for the Barcode of Life Protist Working Group; GOLD, Genomes OnLine Database; OTU97, operational taxonomic unit (>97% sequence identity).
Figure 2
Figure 2
Relative representation of eukaryotic supergroup diversity in different databases. (excluding metazoans, fungi, and land plants). (A) Percentage of described species per eukaryotic supergroup according to the CBOL ProWG. (B) Percentage of 18S rDNA OTU97 per eukaryotic supergroups in GenBank. (C) Percentage of environmental 18S rDNA OTU97 per eukaryotic supergroups. (D) Percentage of species with a cultured strain in any of the analyzed culture collections. Culture data are from five large protist culture collections (n = 3084) (the American Type Culture Collection, Culture Collection of Algae and Protozoa [24], the Roscoff Culture Collection [25], the National Center for Marine Algae and Microbiota [26] and the Culture Collection of Algae at Göttingen University [27]). (E) Relative numbers of species with a genome project completed or in progress according to GOLD, per eukaryotic group. Data from panels A–C are from [8]. Data from panels D and E are publicly available and the taxonomic analysis can be found in the supplementary data online. Abbreviations: CBOL ProWG, Consortium for the Barcode of Life Protist Working Group; Env 18S, environmental 18S rDNA sequences; GOLD, Genomes OnLine Database; OTU97, operational taxonomic unit (>97% sequence identity).
Figure 3
Figure 3
Eukaryotic a diversity distribution among the analyzed databases. (A) The 25 species with the most strains represented in the analyzed culture collections. (B) The 25 speciesa with the most ongoing genome projects. (C) The 25 most abundant SAGs OTU97 in the analyzed dataset. Abbreviations: MAST, marine stramenopile; OTU97, operational taxonomic unit (>97% sequence identity); SAG, single amplified genome. aSome strains are not described at the species level and have been grouped by genus. Therefore they may represent more than a single species.
Figure 4
Figure 4
The tree of eukaryotes, showing the distribution of current effort on culturing, genomics, and environmental single amplified genome (SAG) genomics for the main protistan lineages. Eukaryotic schematic tree representing major lineages. Colored branches represent the seven main eukaryotic supergroups, whereas grey branches are phylogenetically contentious taxa. The sizes of the dots indicate the proportion of species/OTU97 in each database. Culture data are from the analyzed publicly available protist culture collections (n = 3084). Genome data were extracted from the Genomes OnLine Database (GOLD) (n = 258) [9]. SAGs of OTU97 correspond to those retrieved during the Tara Oceans cruise (n = 158) (M.E.S., unpublished data). Taxonomic annotation of all datasets is based on [28]. The ‘big three’ (in bold) have been excluded from this analysis. Abbreviation: OTU97, operational taxonomic unit (>97% sequence identity).

References

    1. Stanier RY, et al. The Microbial World. Prentice-Hall; 1957.
    1. Wu D, et al. A phylogeny-driven genomic encyclopaedia of Bacteria and Archaea. Nature. 2009;462:1056–1060. - PMC - PubMed
    1. Pennisi E. No genome left behind. Science. 2009;326:794–795. - PubMed
    1. Bennetzen J, Kellogg E. A plant genome initiative. Plant Cell. 1998;10:488–494.
    1. Galagan JE, et al. Genomics of the fungal kingdom: insights into eukaryotic biology. Genome Res. 2005;15:1620–1631. - PubMed

LinkOut - more resources