. 2014 Apr 24;7(2):356-365.
doi: 10.1016/j.celrep.2014.03.028. Epub 2014 Apr 13.

Testing the role of myeloid cell glucose flux in inflammation and atherosclerosis

Affiliations

Testing the role of myeloid cell glucose flux in inflammation and atherosclerosis

Tomohiro Nishizawa et al. Cell Rep. .

Abstract

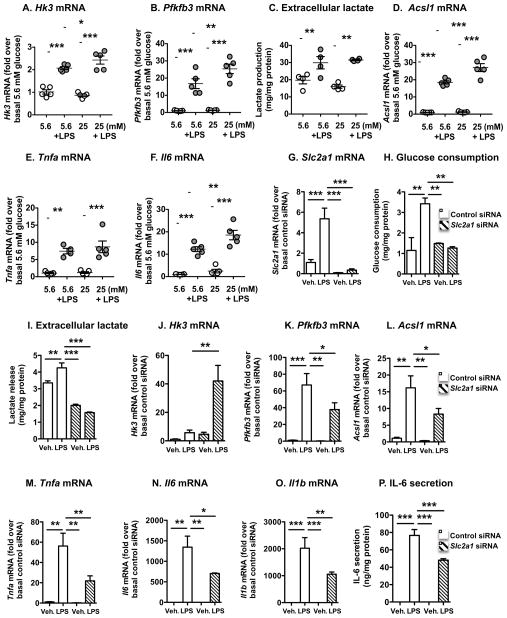
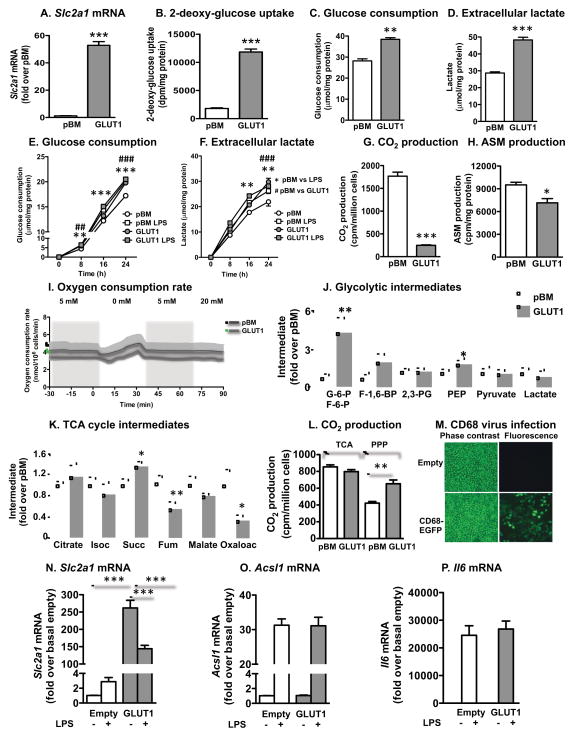
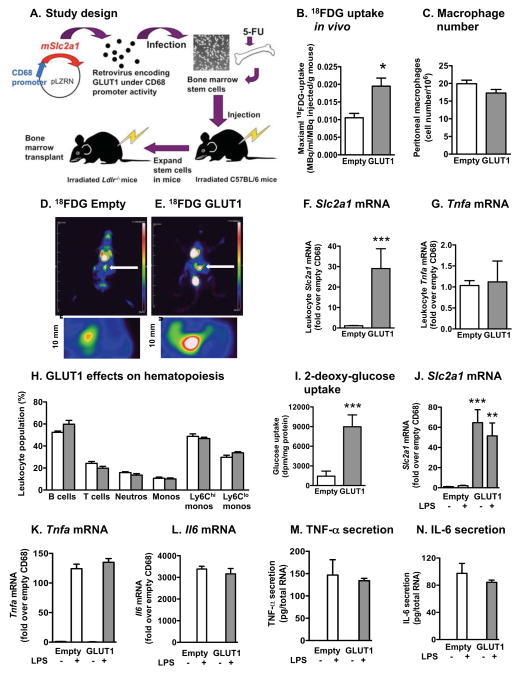
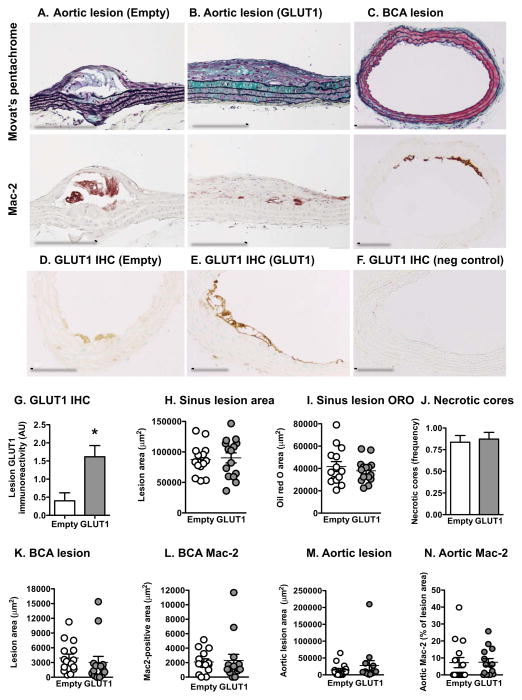
Inflammatory activation of myeloid cells is accompanied by increased glycolysis, which is required for the surge in cytokine production. Although in vitro studies suggest that increased macrophage glucose metabolism is sufficient for cytokine induction, the proinflammatory effects of increased myeloid cell glucose flux in vivo and the impact on atherosclerosis, a major complication of diabetes, are unknown. We therefore tested the hypothesis that increased glucose uptake in myeloid cells stimulates cytokine production and atherosclerosis. Overexpression of the glucose transporter GLUT1 in myeloid cells caused increased glycolysis and flux through the pentose phosphate pathway but did not induce cytokines. Moreover, myeloid-cell-specific overexpression of GLUT1 in LDL receptor-deficient mice was ineffective in promoting atherosclerosis. Thus, increased glucose flux is insufficient for inflammatory myeloid cell activation and atherogenesis. If glucose promotes atherosclerosis by increasing cellular glucose flux, myeloid cells do not appear to be the key targets.


Figures

Figure 1
Figure 1. LPS-stimulated glycolysis and inflammatory activation are dependent on endogenous GLUT1 in macrophages
BMDMs from Ldlr−/− mice were used to measure gene expression of enzymes involved in glycolysis and inflammation. (A–B, D–F) BMDMs differentiated in the presence of 5.6 mM or 25 mM glucose for 7 days were stimulated with LPS (5 ng/mL) or vehicle for 6 h. RNA was extracted and subjected to real-time PCR. (C) Lactate levels in conditioned media collected for the time-period 12–24 h after LPS stimulation were measured by a colorimetric kit. (G–P) GLUT1 expression was knocked down by siRNA in BMDMs maintained in 5.6 mM glucose. Changes in mRNA were measured 6 h after LPS stimulation, whereas glucose consumption, lactate and IL-6 secretion were measured 18 h after stimulation. Results are presented as mean ± SEM (n=3–5). Statistical analysis was performed by one-way ANOVA followed by Neuman Keuls post-hoc test. *p<0.05; **p<0.01; ***p<0.001 compared to indicated group. See also Figure S1
Figure 2
Figure 2. Overexpression of GLUT1 in macrophages mimics the effect of LPS on glycolysis but not inflammation
GLUT1 was overexpressed in J774 macrophages and BMDMs. (A) Slc2a1 levels were measured by real-time PCR in J774 cells transduced with empty pBM or a vector encoding GLUT1. (B) Glucose uptake was measured as [3H]-2-DOG uptake. (C–F) Glucose consumption and extracellular lactate were measured by colorimetric kits in the same samples. CO2 production (G) and acid-soluble metabolite (ASM) production (H) from [14C]palmitate as measures of β-oxidation. (I) Oxygen consumption was measured in real time under different glucose conditions. (J–K) Glycolytic and TCA cycle intermediates were measured in J774 macrophages by LC/ESI-MS/MS. (L) CO2 production from glucose utilized through the TCA cycle and the pentose phosphate pathway (PPP). (M) BMDMs were transduced with the CD68-EGFP vector or CD68-empty vector. The cells were visualized by phase contrast microscopy and fluorescence microscopy. BMDMs were transduced with CD68-GLUT1 or empty control vector, and levels of Slc2a1 mRNA (N) Acsl1 and Il6 mRNA (O–P) were measured by real-time PCR following 16 h stimulation with and without LPS in the presence of 5.6 mM glucose. Results are presented as mean ± SEM (n=3–9). Statistical analysis was performed by one-way ANOVA followed by Neuman Keuls post-hoc test or two-way ANOVA. *p<0.05; **p<0.01; ***p<0.001; ###p<0.001 compared to indicated group or control. Isoc, isocitrate; Succ, succinate; Fum, fumarate. See also Figure S2
Figure 3
Figure 3. Overexpression of GLUT1 in myeloid cells in vivo does not increase their inflammatory phenotype
(A) Study design. (B–E) 18FDG PET analysis of peritoneal macrophages in Ldlr−/− mice fed the low-fat semipurified diet. Foci of peritoneal macrophages are indicated by white arrows and examples of the analyzed areas are shown in higher magnification under the whole mouse images. At the end of the 30 min image collection, peritoneal macrophages were fixed. The next day, the number of cells was determined by counting (C). Slc2a1 and Tnfa mRNA levels were measured by real-time PCR in leukocytes 22 weeks after bone marrow transplants (F–G). (H) Circulating leukocyte populations (% of total live cells) were analyzed by flow cytometry. Ly6Chi and Ly6Clo monocyte populations are expressed as % of total monocytes. At the end of the 22-week study, thioglycollate-elicited macrophages were collected and adherence purified for 1 h. (I) Glucose uptake was measured by [3H]-2-DOG uptake. (J–L) Slc2a1, Tnfa, and Il6 mRNA levels were measured by real-time PCR. (M–N) Macrophages were stimulated in the presence or absence of LPS for 24 h, and TNF-α and IL-6 secretion was measured by ELISA. Results are presented as mean ± SEM (n=3–5). Statistical analysis was performed by two-tailed unpaired Student’s t-test or one-way ANOVA followed by Neuman Keuls post-hoc test. *p<0.05; **p<0.01; ***p<0.001 compared to empty control virus. See also Figure S3
Figure 4
Figure 4. Overexpression of GLUT1 in myeloid cells does not increase atherosclerosis
(A–B) The aorta was embedded longitudinally and sections were stained using a Movat’s pentachrome stain or an anti-Mac-2 antibody. Representative longitudinal sections are shown. (C) The maximal lesion site in the BCA was identified, and this site was used for Movat’s pentachrome stain and Mac-2 and GLUT1 immunohistochemitry. Representative cross sections from a CD68-GLUT1 mouse are shown. (D–G) GLUT1 immunoreactivity in lesion macrophages. (F) Negative controls showed no immunoreactivity. Sinus lesion area (H) and oil red O-positive area (I) were quantified on five cross sections and measured by image analysis. (J) The presence of necrotic cores in sinus lesions were scored in a blinded bi-modal fashion and expressed as mean frequency. (K) BCA lesion area was quantified at the maximal lesion area site. (L) Mac-2 positive area was quantified in sections adjacent to those in (K). (M–N) Aortic lesion area and Mac-2-positive lesion area were quantified. Results are presented as mean ± SEM (n=14–15). See also Figure S4

References

    1. Adhikari N, Basi DL, Carlson M, Mariash A, Hong Z, Lehman U, Mullegama S, Weir EK, Hall JL. Increase in GLUT1 in smooth muscle alters vascular contractility and increases inflammation in response to vascular injury. Arterioscler Thromb Vasc Biol. 2011;31:86–94. - PMC - PubMed
    1. Bornfeldt KE, Tabas I. Insulin resistance, hyperglycemia, and atherosclerosis. Cell Metab. 2011;14:575–585. - PMC - PubMed
    1. Brown A, Reynolds LR, Bruemmer D. Intensive glycemic control and cardiovascular disease: an update. Nat Rev Cardiol. 2010;7:369–375. - PubMed
    1. Cline GW, Jucker BM, Trajanoski Z, Rennings AJ, Shulman GI. A novel 13C NMR method to assess intracellular glucose concentration in muscle, in vivo. Am J Physiol. 1998;274(2 Pt 1):E381–E389. - PubMed
    1. Everts B, Amiel E, van der Windt GJ, Freitas TC, Chott R, Yarasheski KE, Pearce EL, Pearce EJ. Commitment to glycolysis sustains survival of NO-producing inflammatory dendritic cells. Blood. 2012;120:1422–1431. - PMC - PubMed

Publication types