. 2014 May 6;19(5):795-809.
doi: 10.1016/j.cmet.2014.03.003. Epub 2014 Apr 10.

Targeting lactate dehydrogenase--a inhibits tumorigenesis and tumor progression in mouse models of lung cancer and impacts tumor-initiating cells

Affiliations

Targeting lactate dehydrogenase--a inhibits tumorigenesis and tumor progression in mouse models of lung cancer and impacts tumor-initiating cells

Han Xie et al. Cell Metab. .

Abstract

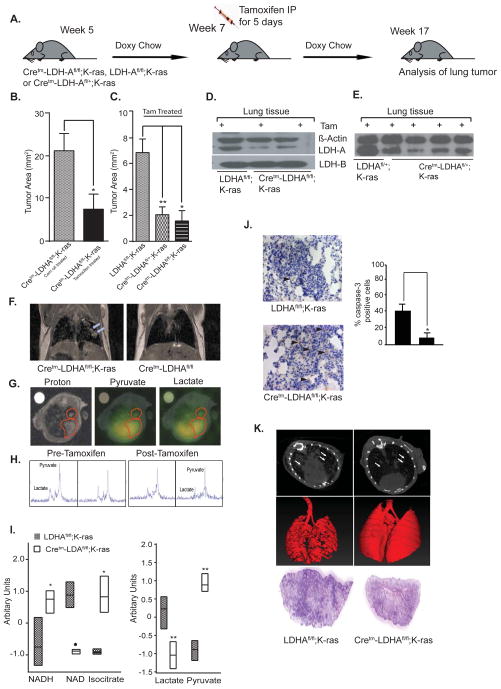
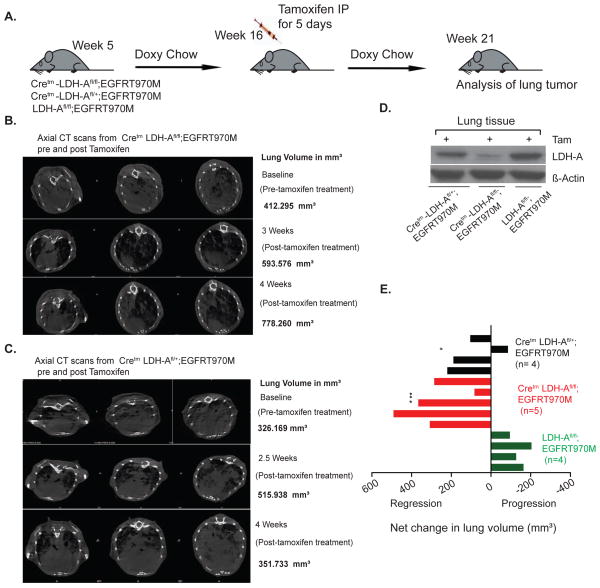
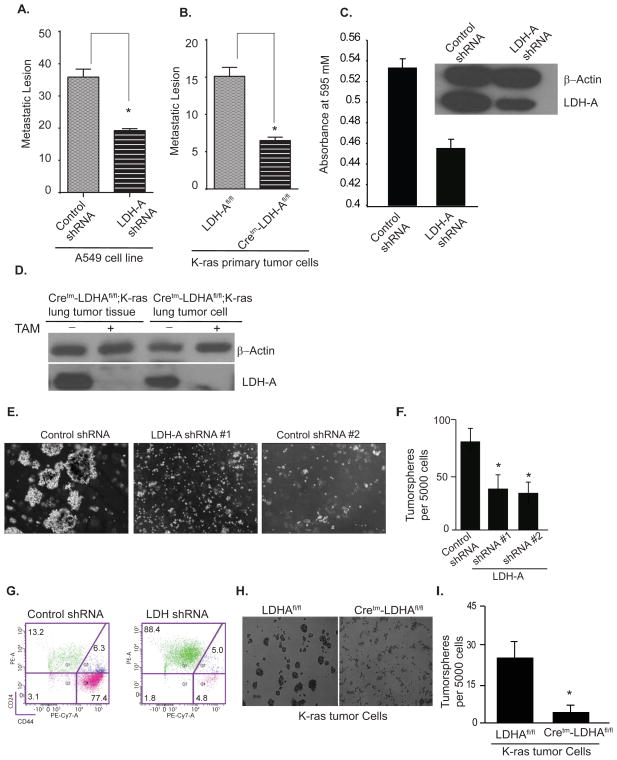
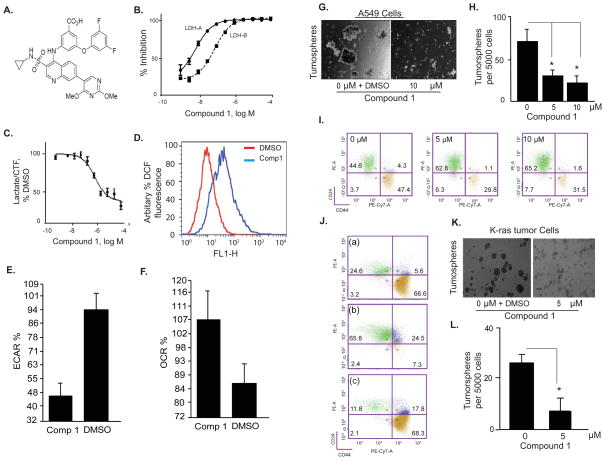
The lactate dehydrogenase-A (LDH-A) enzyme catalyzes the interconversion of pyruvate and lactate, is upregulated in human cancers, and is associated with aggressive tumor outcomes. Here we use an inducible murine model and demonstrate that inactivation of LDH-A in mouse models of NSCLC driven by oncogenic K-RAS or EGFR leads to decreased tumorigenesis and disease regression in established tumors. We also show that abrogation of LDH-A results in reprogramming of pyruvate metabolism, with decreased lactic fermentation in vitro, in vivo, and ex vivo. This was accompanied by reactivation of mitochondrial function in vitro, but not in vivo or ex vivo. Finally, using a specific small molecule LDH-A inhibitor, we demonstrated that LDH-A is essential for cancer-initiating cell survival and proliferation. Thus, LDH-A can be a viable therapeutic target for NSCLC, including cancer stem cell-dependent drug-resistant tumors.


Figures

Fig. 1
Fig. 1. LDH-A expression is required for initiation of oncogenic K-RAS-induced tumorigenesis
(A) Schematic representation of an experiment where LDH-A knockdown was initiated 14 days after K-RAS induction by doxycycline diet. (B) Tumor areas of Cretm-LDH-Afl/fl;K-RAS mice treated with tamoxifen (n=7) or corn oil (n=6). (C) Tumor areas of Cretm-LDH-Afl/fl;K-RAS (n=3), Cretm-LDH-Afl/+;K-RAS (n=5) and LDH-Afl/fl;K-RAS (Cretm negative) mice (n=4) treated with tamoxifen (data in B and C are represented as mean ± SD, *= p < 0.05, **= p <0.01 as calculated by two tailed t test). (D) Representative western blot analysis of tumor (along with non-malignant cells) for LDH-A, LDH-B, and beta-actin from LDH-Afl/fl;K-RAS and Cretm-LDH-Afl/fl;K-RAS mice. (E) Representative western blot analysis of tumor (along with non-malignant cells) for LDH-A, and beta-actin from LDH-Afl/fl;K-RAS and Cretm-LDH-Afl/+;K-RAS mice (F) Coronal proton density weight images showing comparison of lungs in Cretm-LDH-Afl/fl;K-RAS mouse on doxycycline diet (left) and Cretm-LDH-Afl/fl mouse (right). Tumors are indicated by arrows in image on left. (G) Proton (left), pyruvate (center), and lactate (right) images acquired in Cretm-LDH-Afl/fl;K-RAS mice prior to tamoxifen administration. Red outlines are drawn around lung lesions. (H) Spectra acquired before (two left panels) and after (two right panels) tamoxifen withdrawal, with signals from pyruvate (pyr) and lactate (lac) labeled at left. (I) Metabolic profiling analysis of NADH, NAD+, isocitrate, lactate, and pyruvate from LDH-Afl/fl;K-RAS v/s. Cretm-LDH-Afl/fl;K-RAS (see Fig. S3 for other pathway specific metabolites). (J) Representative caspase-3 staining of tumors from Cretm-LDH-Afl/fl;K-RAS (top panel), and LDH-Afl/fl;K-RAS (bottom panel); quantitation of caspase 3 staining is shown on the right (means ± SD of n= 4 mice each). (K) Axial CT images and anterior/posterior (A/P) reconstruction from chest/lung and H&E staining of a lung section from LDH-Afl/fl;K-RAS (left panel) and Cretm-LDH-Afl/fl;K-RAS treated with tamoxifen (right panel).
Fig. 2
Fig. 2. Reduction in LDH-A levels results in reduced tumorigenesis of established tumors in a K-RAS-driven NSCLC model
(A) Schematic representation of an experiment where LDH-A knockdown was initiated ~83 days after K-RAS induction by doxycycline diet. (B & C) Tumor areas of Cretm-LDH-Afl/fl;K-RAS (n=12), Cretm-LDH-Afl/+;K-RAS (n=7), and LDH-Afl/fl;K-RAS (n=6) mice that were treated with tamoxifen. Data is representated as mean ± SD, **=p, 0.01, *= p < 0.05 (two tailed t test) (D) Representative western blot analysis of tumors (along with non-malignant cells) from LDH-Afl/fl;K-RAS, Cretm-LDH-Afl/+;K-RAS, and Cretm-LDH-Afl/fl;K-RAS mice for LDH-A, LDH-B, and beta-actin. (E) Axial CT images and anterior/posterior (A/P) reconstruction from chest/lung from LDH-Afl/fl;K-RAS mice (left panel) and Cretm-LDH-Afl/fl;K-RAS mice treated with tamoxifen (right panel) with tumors indicated by arrows (F) Representative coronal and transverse images of lung/chest from same pre and post tamoxifen treated Cretm-LDH-Afl/fl;K-RAS mice (n=5) in comparison to LDH-Afl/fl;K-RAS mice (n=3).
Fig. 3
Fig. 3. Reduction in LDH-A levels results in reduced tumorigenesis of established tumors in EGFR- L858R-T970M driven NSCLC model
(A) Schematic representation of an experiment where LDH-A knockdown was initiated ~80 days after EGFR-T970M mutation induction by doxycycline diet. (B & C) Representative axial CT scans from pre and post Tamoxifen tumor volume of Cretm-LDH-Afl/fl;EGFR-T970M, Cretm-LDH-Afl/+;EGFR-T970M mice. (D) Representative western blot analysis of tumors (along with non-malignant cells) from LDH-Afl/fl;K-RAS, Cretm-LDH-Afl/+;K-RAS, and Cretm-LDH-Afl/fl;K-RAS mice for LDH-A, and beta-actin. (E) Graphical representation of volumetric changes in lung volume pre and post tamoxifen Cretm-LDH-Afl/fl;EGFR-T970M (n=5), Cretm-LDH-Afl/+; EGFRT-970M (n=4), and LDH-Afl/fl; EGFRT970M (n=4) mice that were treated with tamoxifen. Statistical data values are significant as tested by Dunnett’s multiple comparisons test between all three genotypes (* WT to heterozygous and *** WT to homozygous).
Fig. 4
Fig. 4. LDH-A knockdown results in reduction of oncogenic K-RAS-induced cancer stem cells
Top Panel: Cancer-initiating cells within oncogenic K-RAS-expressing tumors are susceptible to LDH-A abrogration. (A) Cancer-initiating lesions from lungs of syngeneic mice (n=5) that were injected via tail vein with A549 cells expressing either control shRNA or LDH-A shRNA. Cancer-initiating lesions in (A) and (B) were scored after 24 days. (B) Cancer-initiating lesions from lungs of syngeneic mice (n=5) that were injected via tail vein with isolated tumor cells from tamoxifen-treated Cretm-LDH-Afl/fl;K-RAS (n=3) or LDH-Afl/fl;K-RAS (n=2) mice. Data is expressed as ± SEM (**=p < 0.01). (C) In vitro matrigel invasion assay with A549 cells expressing either control shRNA or LDH-A shRNA. Absorbance at 595 nm reflects the number of migrated cells. (D) Western immunoblotting for LDH-A and beta-actin of cells used in in vitro invasion and in vivo cancer initiation assays. Bottom Panel: Stem cell populations within oncogenic ras-expressing cell lines are reduced by LDH-A shRNA. (E) A549 human NSCLC cells expressing control shRNA or two different LDH-A shRNAs were analyzed in tumorsphere formation assay and (F) Quantification of the results expressed as mean ± SD (*=p < 0.05) (G) FACS analysis of stem cell populations using CD44 and CD24 antibodies in Ras-transformed HMLE (HMLER) and shRNA-LDH-A-HMLER. (H) Tumorsphere formation assay using tumor cells isolated from Cretm-LDH-Afl/fl;K-RAS or LDH-Afl/fl;K-RAS mice and (I) Graphical quantification of the results expressed as mean ± SD (*=p <0.05).
Fig. 5
Fig. 5. Small molecule LDH-A inhibitor reduces the number of Ras-induced tumor stem cells
Left Panel: (A) Chemical structure of the Compound 1. (B) Compound 1 inhibits activity of recombinant human LDH-A (IC50=4.8±1.1 nM) and LDH-B (IC50=53.1±0.9 nM) enzymes. The signal obtained in absence of LDH was set as 100% inhibition and the signal obtained in absence of Compound 1 was set as 0% inhibition (DMSO control, not included on the graphs). Data are means ± SD of two readings, representative of 6 independent experiments. (C) Compound 1 inhibits lactate production in HepG2 human hepatocellular carcinoma cells. Lactate concentration was normalized to cell viability assessed by CellTiter-Fluor assay (CTF), and the lactate/CTF ratio obtained in DMSO-treated cells was set at 100%. (D) Compound 1 (10 μM) increases ROS activity in A549 cells as measured by DCF fluorescence (representative of two independent experiments). (E) Compound 1 (10 μM) increases oxygen consumption rate (OCR) and (F) decreased extracellular acidification rate (ECAR) in A549 cells. XF-24 seahorse cell analyzer was used to obtain the data (means ± SD of n=2). Right Panel: (G & H) Tumorsphere formation assay with A549 cells using vehicle control or 10 μM Compound 1 with graphical quantitation of the results expressed as mean ± SD (*=p< 0.05). (I) FACS analysis using CD44 and CD24 antibodies for stem cell population in ras-transformed HMLE (HMLER) treated with 0, 5 and 10 μM Compound 1 for 30 hours. (J) Decrease in the stem cell population in HMLER by compound1 treatment is specific as shows that CD24/44 positive cells re-appear after withdrawal of the inhibitor (a) plated in absence of compound 1, (b) switched to media containing compound 1 for 24 hours, and (c), switched back to media without compound 1 for additional 24 hours. (K & L) Tumorsphere formation assay with tumor cells isolated from LDH-Afl/fl;K-RAS mice treated with DMSO or 5 μM Compound 1, with graphical quantitation of results expressed as mean +/SD (p < 0.05).
Fig. 6
Fig. 6. Enhanced utilization of labeled glucose and glutamine via the Krebs cycle in LDH-A suppressed A549 cells
(A & B) A549 cells transduced with an empty vector (PLKO) or shRNA targeting LDH-A (LDH) were grown in 13C6-glucose (A) or 13C5,15N2-Gln (B) tracers for 24 h, as described in Methods. The polar extracts were analyzed by GC-MS for the distribution of various 13C isotopologues (same metabolites with different numbers of 13C atoms) of the Krebs cycle metabolites. Also shown in panels A and B are the atom-resolved Krebs cycle tracings with each respective tracer. The m2 (13C2) or m4 (13C4) isotopologues derived from either tracer via the Krebs cycle without input from pyruvate carboxylation (PC) are denoted with red rectangles while the m3 (13C3) isotopologues derived from 13C6-glucose via PC are highlighted with green rectangles. Metabolite concentrations are means ± SD of two or three replicates. Solid and dashed arrows: single and multiple step reactions; single- and double-headed arrows: irreversible and reversible reactions, respectively; αKG: αketoglutarate; ●: 12C; formula image, formula image
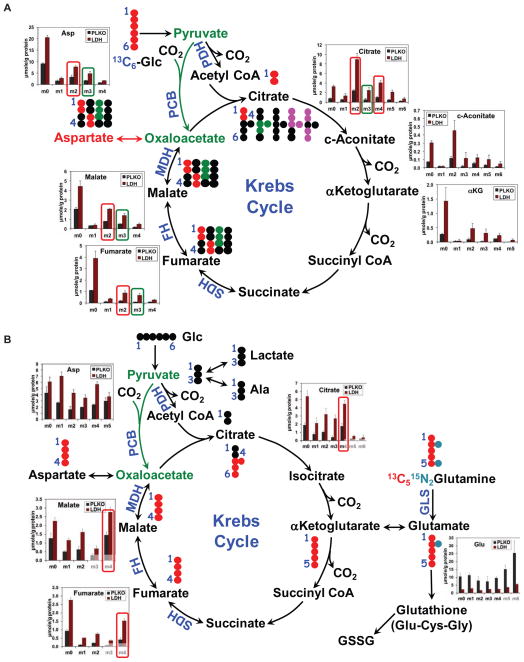
: 13C in the first and second turn without PC input; formula image: 13C with PC input.
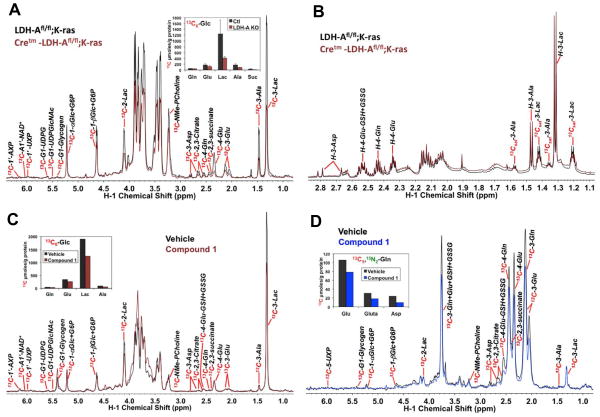
Fig. 7
Fig. 7. LDH-A suppression in Cretm-LDH-Afl/fl;K-RAS, mouse lung tumors and its pharmacological inhibition in primary human lung tumor tissue blocked glucose oxidation via glycolysis without activating the Krebs cycle
(Top panel) Four each LDH-Afl/fl;K-RAS (Ctl) and Cretm-LDH-Afl/fl;K-RAS (LDH-A KO) mice were tail vein injected with 20 mg of 13C6-glucose in sterile PBS 3 times at 15 minute intervals prior to dissection for lung tumor tissues (one of the LDH-A KO mice had insufficient tissue for metabolite analysis). Polar metabolites were extracted from frozen pulverized tissue powder and analyzed by 1D 1H and 1H-{13C} HSQC NMR as described for Warburg slices in Methods. (A) Displays the HSQC spectra for one pair of control versus LDH-A knockdown mouse tumors, where the intensity of each assigned metabolite 1H signal reflect the 13C abundance of the attached carbon. Also shown is the average content (mean±SE) of selected 13C-labeled glycolytic and Krebs cycle metabolites (as 13C μmole/g protein) obtained from the HSQC data (4 each for Ctl and LDH-A KO). 13C-metabolites were quantified from the peak areas of respective HSQC resonances using the 13C-3-Lac resonance as a calibrator. The 13C abundance of 3-Lac was obtained from the 1H NMR spectra as in (B) calibrated against the DSS standard. Lac: lactate; NMe-PCholine: N-methyl protons of phosphocholine; Glc: glucose; G6P: glucose-6-phosphate; UDP-GlcNAc: UDP-N-acetylglucosamine; UXP: uracil nucleotides; AXP: adenine nucleotides. LDH-A KO induced reduced production of 13C-lactate from 13C6-glucose, which is consistent with decreased glycolytic flow while it also elicited attenuated synthesis of 13C-Ala, -Glu, -succinate, -citrate, and –Asp but this attenuation did not reach statistical significance (cf. Fig. S4). Suffice to say, Krebs cycle activity was not activated by LDH-A suppression. (B) Shows the 1H spectrum of one of the five pairs of tumors. 13Csat-3-Lac: the 13C satellite peaks of the H3 of lactate, the pattern of which indicate fully 13C labeled lactate; GSH+GSSG: reduced and oxidized glutathiones. Reduced production of 13C-lactate and -Ala with little changes in the levels of the unlabeled counterparts is evident. (Bottom panel) Two tissue slices were procured from one resected human NSCLC tumor, each treated with 13C6-glucose and 13C5,15N2-glutamine, and processed as described in Materials and Methods. (C and D) display respectively the 1D 1H-{13C} HSQC spectra of 13C6-glucose and 13C5,15N2-glutamine treated slices with or without LDH-A inhibitor (10 μM Compound 1). Also shown is the content of selected 13C-labeled glycolytic and Krebs cycle metabolites (as 13C μmole/g protein, determined as in (A)) obtained from the HSQC data. LDH-A inhibitor-induced reduction in 13C-lactate production from 13C6-glucose is evident in (C) while decreased synthesis of Krebs cycle metabolites (succinate, citrate, and Asp) and glutathiones from 13C5,15N2-glutamine in response to LDH-A inhibition is shown in (D). Also clear from (D) is the lack of change in 13C-lactate production from 13C5,15N2-glutamine with LDH-A inhibition.

References

    1. Agathocleous M, Love NK, Randlett O, Harris JJ, Liu J, Murray AJ, Harris WA. Metabolic differentiation in the embryonic retina. Nat Cell Biol. 2012;14:859–864. - PMC - PubMed
    1. Ailles LE, Weissman IL. Cancer stem cells in solid tumors. Curr Opin Biotechnol. 2007;18:460–466. - PubMed
    1. Al-Hajj M, Wicha MS, Benito-Hernandez A, Morrison SJ, Clarke MF. Prospective identification of tumorigenic breast cancer cells. Proc Natl Acad Sci U S A. 2003;100:3983–3988. - PMC - PubMed
    1. Amann J, Kalyankrishna S, Massion PP, Ohm JE, Girard L, Shigematsu H, Peyton M, Juroske D, Huang Y, Stuart Salmon J, et al. Aberrant epidermal growth factor receptor signaling and enhanced sensitivity to EGFR inhibitors in lung cancer. Cancer Res. 2005;65:226–235. - PubMed
    1. Billiard J, Dennison JB, Briand J, Annan RS, Chai D, Colon M, Dodson CS, Gilbert SA, Greshock J, Jing J, et al. Quinoline 3-sulfonamides inhibit lactate dehydrogenase A and reverse aerobic glycolysis in cancer cells. Cancer Metab. 2013;1:19. - PMC - PubMed

Publication types

MeSH terms