. 2014 Apr 24;157(3):611-23.
doi: 10.1016/j.cell.2014.02.052. Epub 2014 Apr 10.

Water permeation drives tumor cell migration in confined microenvironments

Affiliations

Water permeation drives tumor cell migration in confined microenvironments

Kimberly M Stroka et al. Cell. .

Abstract

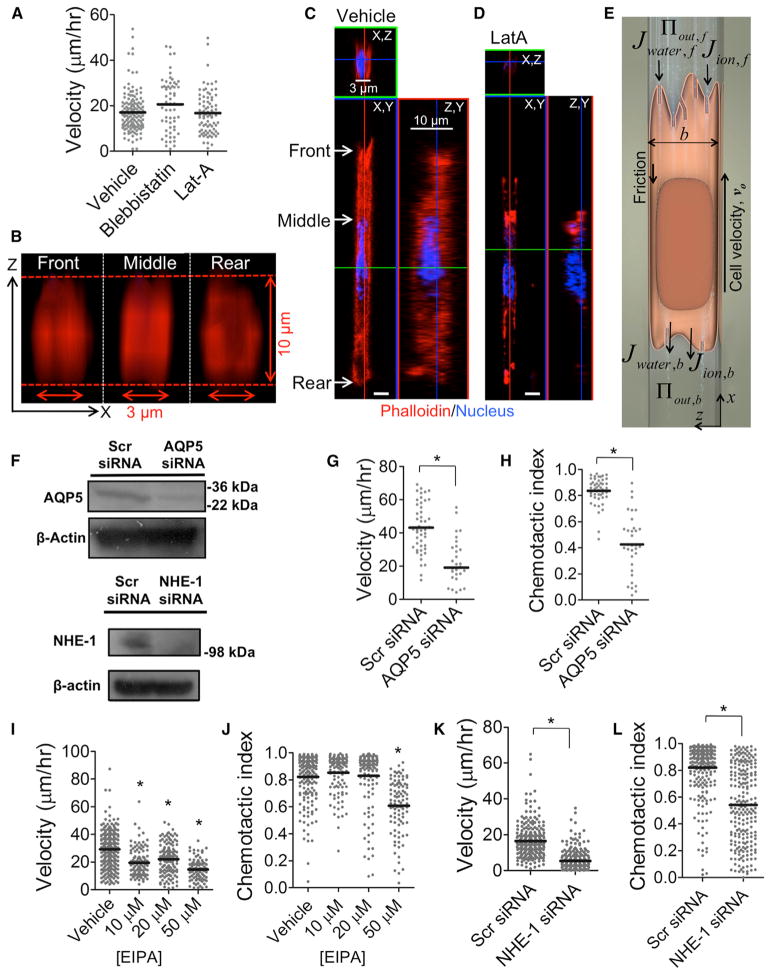
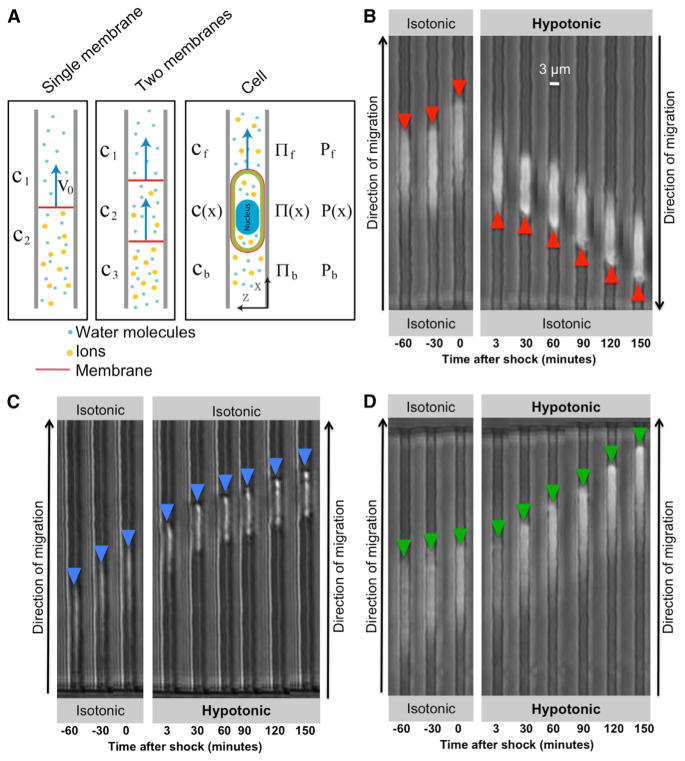
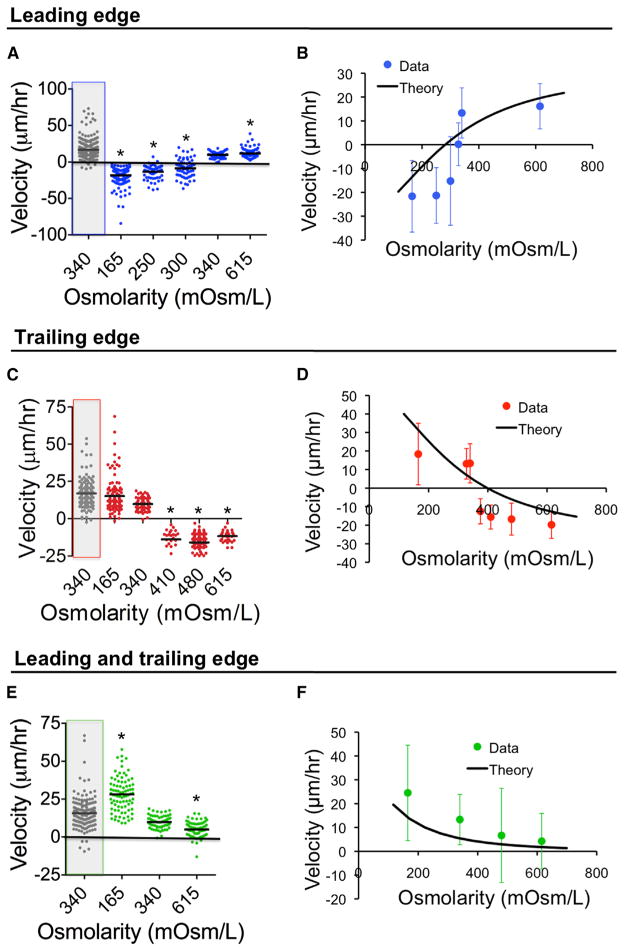
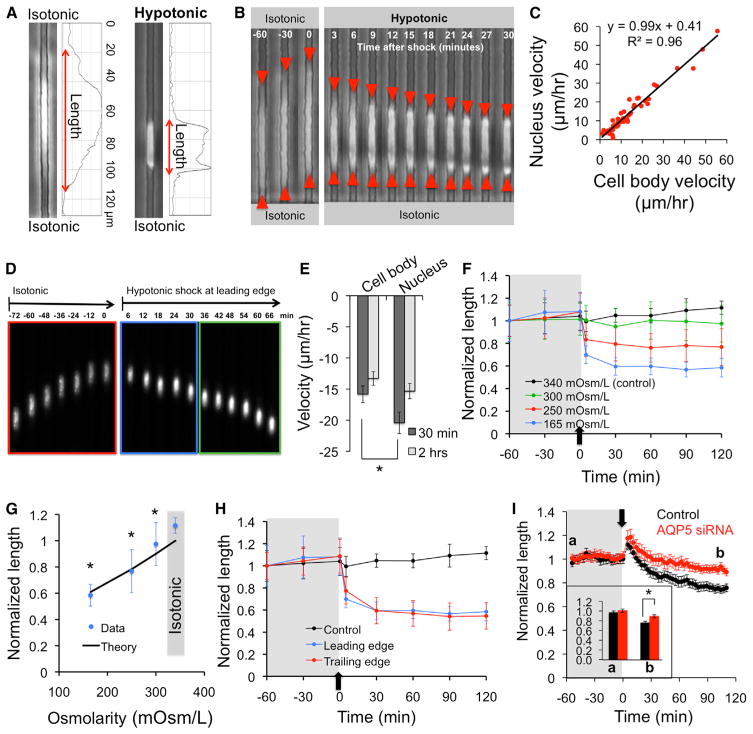
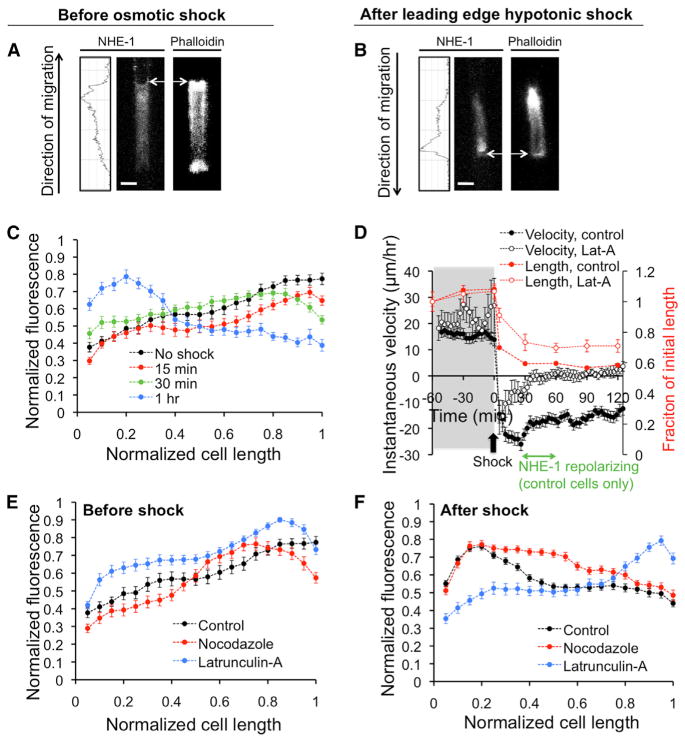
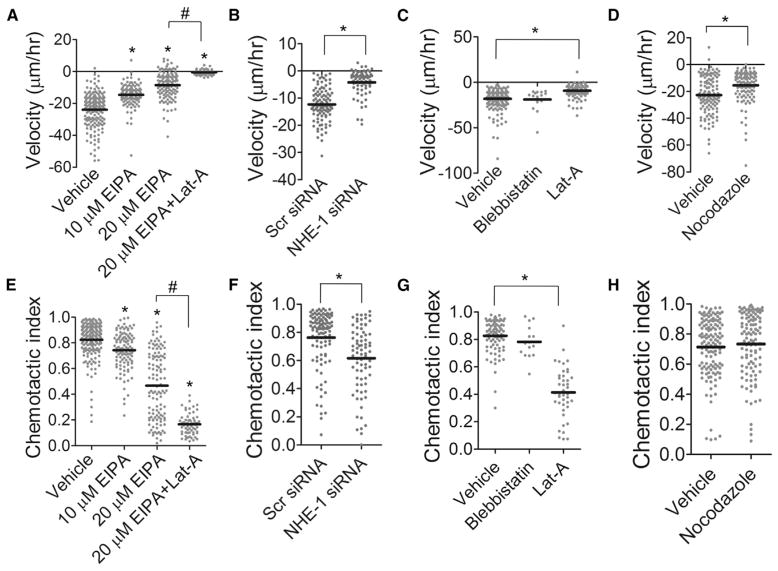
Cell migration is a critical process for diverse (patho)physiological phenomena. Intriguingly, cell migration through physically confined spaces can persist even when typical hallmarks of 2D planar migration, such as actin polymerization and myosin II-mediated contractility, are inhibited. Here, we present an integrated experimental and theoretical approach ("Osmotic Engine Model") and demonstrate that directed water permeation is a major mechanism of cell migration in confined microenvironments. Using microfluidic and imaging techniques along with mathematical modeling, we show that tumor cells confined in a narrow channel establish a polarized distribution of Na+/H+ pumps and aquaporins in the cell membrane, which creates a net inflow of water and ions at the cell leading edge and a net outflow of water and ions at the trailing edge, leading to net cell displacement. Collectively, this study presents an alternate mechanism of cell migration in confinement that depends on cell-volume regulation via water permeation.


Figures

Figure 1
Figure 1. Migration in Confined Spaces Requires AQPs and Na+/H+ Exchangers but Not Actin Polymerization
(A) S180 cell velocity in the presence of 50 μM blebbistatin or 2 μM latrunculin-A (Lat-A). Each data point represents average velocity of one cell over the course of 2 hr. Horizontal bars indicate mean. (B) Front, middle, and rear (X, Z) plane reconstructions of the actin cytoskeleton for the cell in (C). (C) Vehicle control- or (D) Lat-A-treated S180 cells were stained for actin by phalloidin-Alexa 568, and cross-sections of confocal images are shown. White scale bars represent 3 μm. (E) Schematic of the Osmotic Engine Model, based on water permeation through the cell membrane at leading and trailing edges. (F) Immunoblots indicating knock down of AQP5 in MDA-MB-231 cells and NHE-1 in S180 cells. (G and H) Velocity (G) and chemotactic index (H) of scramble control and AQP5-depleted MDA-MB-231 cells. (I and J) Velocity (I) and chemotactic index (J) of S180 cells treated with increasing concentrations of EIPA. (K and L) Velocity (K) and chemotactic index (L) of scramble control and NHE-1 siRNA-transfected S180 cells. *p < 0.05 in comparison with control by Student’s t test. All migration experiments were performed in 3 μm-wide channels. See also Figure S1.
Figure 2
Figure 2. Localized Osmotic Shocks Influence Cell Migration in Confined Spaces
(A) Schematics showing the movement of a moveable semipermeable membrane, a vesicle enclosed by a semipermeable membrane, and a cell driven by osmotic pressure difference (see Extended Experimental Procedures for further explanation). (B–D) Also shown are phase-contrast image sequences of S180 cells before shock and after (B) a hypotonic shock at the leading edge, (C) a hypotonic shock at the trailing edge, or (D) a hypotonic shock at both the leading and trailing edges. Hypotonic shock = 165 mOsm/l. See also Figure S2 and Movie S1.
Figure 3
Figure 3. The Osmotic Engine Model Predicts Cell-Velocity Patterns in Response to Osmotic Shocks
S180 cell velocity as a function of osmotic shock at the (A) leading edge, (C) trailing edge, or (E) both leading and trailing edges. In (A), (C), and (E), gray boxes indicate migration velocity before shock, whereas data with white background represent an osmotic shock (or media change only, in the case of 340 mOsm/l control). *p < 0.05 in comparison with control (340 mOsm/l postshock) by Student’s t test. All migration experiments were performed in 3 μm-wide channels. Theoretical predictions using one set of parameters are also shown for velocity as a function of osmotic shock at the (B) leading edge, (D) trailing edge, or (F) both leading and trailing edges. Data points in (B), (D), and (F) represent mean ± SD. See also Figure S3.
Figure 4
Figure 4. Hypotonic Shocks Produce a Nonintuitive Decrease in Cell Volume during Migration in Confined Spaces
(A) S180 cell length was computed based on the plot profiles of phase-contrast images. (B) Phase-contrast sequence indicating the decrease in S180 cell length, mostly from the original leading edge, following a hypotonic shock (165 mOsm/l) at the leading edge. (C) Nucleus versus cell-body velocity for S180 cells before osmotic shock. (D and E) Fluorescence images of nucleus translocation in S180 cells (D) and velocities (computed over first 30 min or 2 hr) of cell body and nucleus (E) after a hypotonic shock at the leading edge. Bars indicate mean ± SEM, *p < 0.05. (F) S180 cell length normalized to initial value (at t = −60 min, preshock) as a function of time before and after various hypotonic shocks at the leading edge. (G) Normalized lengths of S180 cells at equilibrium (t = 120 min) following a hypotonic shock at the leading edge, overlaid with the theoretical prediction. (H) Normalized S180 cell length as a function of time before and after a hypotonic (165 mOsm/l) shock at the leading or trailing edge. (I) Normalized control and AQP5-depleted MDA-MB-231 cell length as a function of time before and after a hypotonic (165 mOsm/l) shock at the leading edge. Data points represent mean ± SD. *p < 0.05 in comparison with (G) isotonic case or (I) scramble control by Student’s t test. All migration experiments were performed in 3 μm-wide channels. See also Figure S4.
Figure 5
Figure 5. NHE-1 Polarizes to the Leading Edges of Cells Migrating in Confinement
(A and B) Confocal images and corresponding NHE-1 plot profiles of S180 cells stained for NHE-1 or for actin by phalloidin-Alexa 488, (A) in isotonic medium or (B) after a hypotonic shock at the leading edge. White scale bars represent 3 μm, whereas white arrows point to cell’s leading edge. (C) Normalized NHE-1 fluorescence intensity (to maximum value for each cell) as a function of the normalized cell length (to maximum cell length), for isotonic conditions, or at various time points following a hypotonic shock at the leading edges of S180 cells. (D) Instantaneous velocity (primary y axis) and normalized cell length (secondary y axis) as a function of time before and after a hypotonic shock at the leading edge of control and Lat-A-treated S180 cells. Data points represent mean ± SEM of at least 150 cells. The time during which NHE-1 repolarizes in control cells, according to (C), is indicated in green in this panel. (E and F) Also shown are plots of normalized fluorescence intensity as a function of normalized cell length for control-, nocodazole-, or Lat-A-treated S180 cells (E) in isotonic conditions or (F) after a hypotonic shock at the leading edge. In (C), (E), and (F), data points represent mean ± SEM of at least 30 cells. All experiments were performed in 3 μm-wide channels. Hypotonic shock = 165 mOsm/l. See also Figure S5.
Figure 6
Figure 6. Cell Migration in Confinement after an Osmotic Shock Depends on an Interplay between Na+/H+ Exchangers and Actin Polymerization
(A–D) Velocity for (A) EIPA- or EIPA+Lat-A-, (B) NHE-1 siRNA-, (C) blebbistatin- or Lat-A-, and (D) nocodazole-treated S180 cells migrating in 3 μm channels. (E–H) Also shown is the chemotactic index for (E) EIPA- or EIPA+Lat-A-, (F) NHE-1 siRNA-, (G) blebbistatin- or Lat-A, and (H) nocodazole-treated S180 cells. *p < 0.05 in comparison with control by ANOVA followed by Tukey test (A and E) or Student’s t test (B, C, D, F, G, and H). #p < 0.05 between groups indicated. All migration experiments were performed in 3 μm-wide channels. See also Figure S6.

References

    1. Alexander S, Koehl GE, Hirschberg M, Geissler EK, Friedl P. Dynamic imaging of cancer growth and invasion: a modified skin-fold chamber model. Histochem Cell Biol. 2008;130:1147–1154. - PubMed
    1. Atzberger PJ, Isaacson S, Peskin CS. A microfluidic pumping mechanism driven by non-equilibrium osmotic effects. Physica D. 2009;238:1168–1179.
    1. Balzer EM, Tong Z, Paul CD, Hung WC, Stroka KM, Boggs AE, Martin SS, Konstantopoulos K. Physical confinement alters tumor cell adhesion and migration phenotypes. FASEB J. 2012;26:4045–4056. - PMC - PubMed
    1. Beltran AR, Ramirez MA, Carraro-Lacroix LR, Hiraki Y, Reboucas NA, Malnic G. NHE1, NHE2, and NHE4 contribute to regulation of cell pH in T84 colon cancer cells. Pflugers Arch. 2008;455:799–810. - PubMed
    1. Chae YK, Woo J, Kim MJ, Kang SK, Kim MS, Lee J, Lee SK, Gong G, Kim YH, Soria JC, et al. Expression of aquaporin 5 (AQP5) promotes tumor invasion in human non small cell lung cancer. PLoS ONE. 2008;3:e2162. - PMC - PubMed

Publication types