

Linsitinib (OSI-906) antagonizes ATP-binding cassette subfamily G member 2 and subfamily C member 10-mediated drug resistance
- PMID: 24726739
- PMCID: PMC7670583
- DOI: 10.1016/j.biocel.2014.03.026
Linsitinib (OSI-906) antagonizes ATP-binding cassette subfamily G member 2 and subfamily C member 10-mediated drug resistance
Abstract
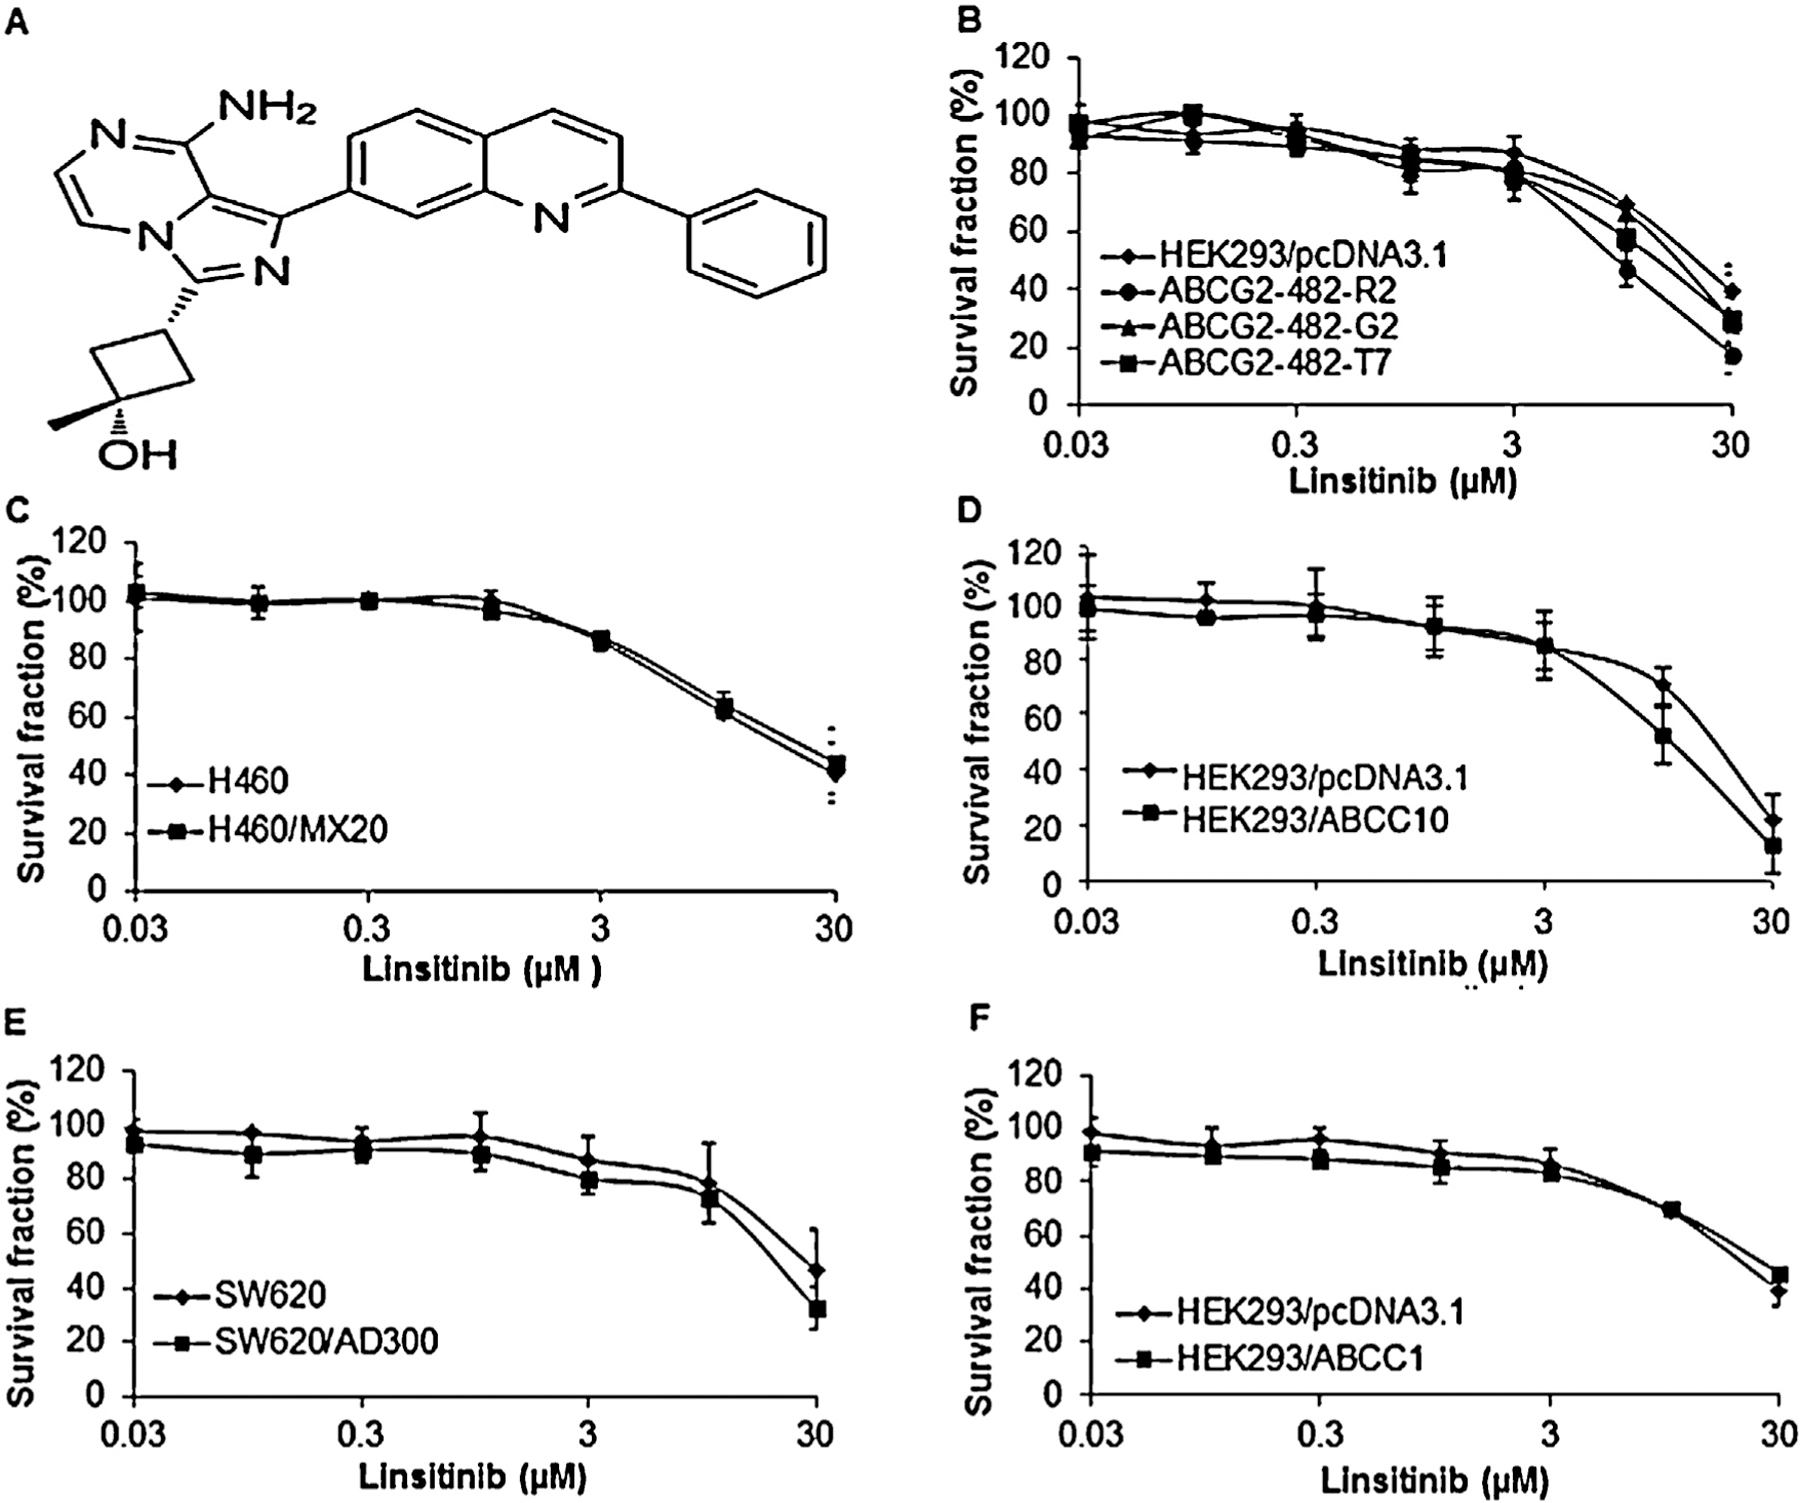
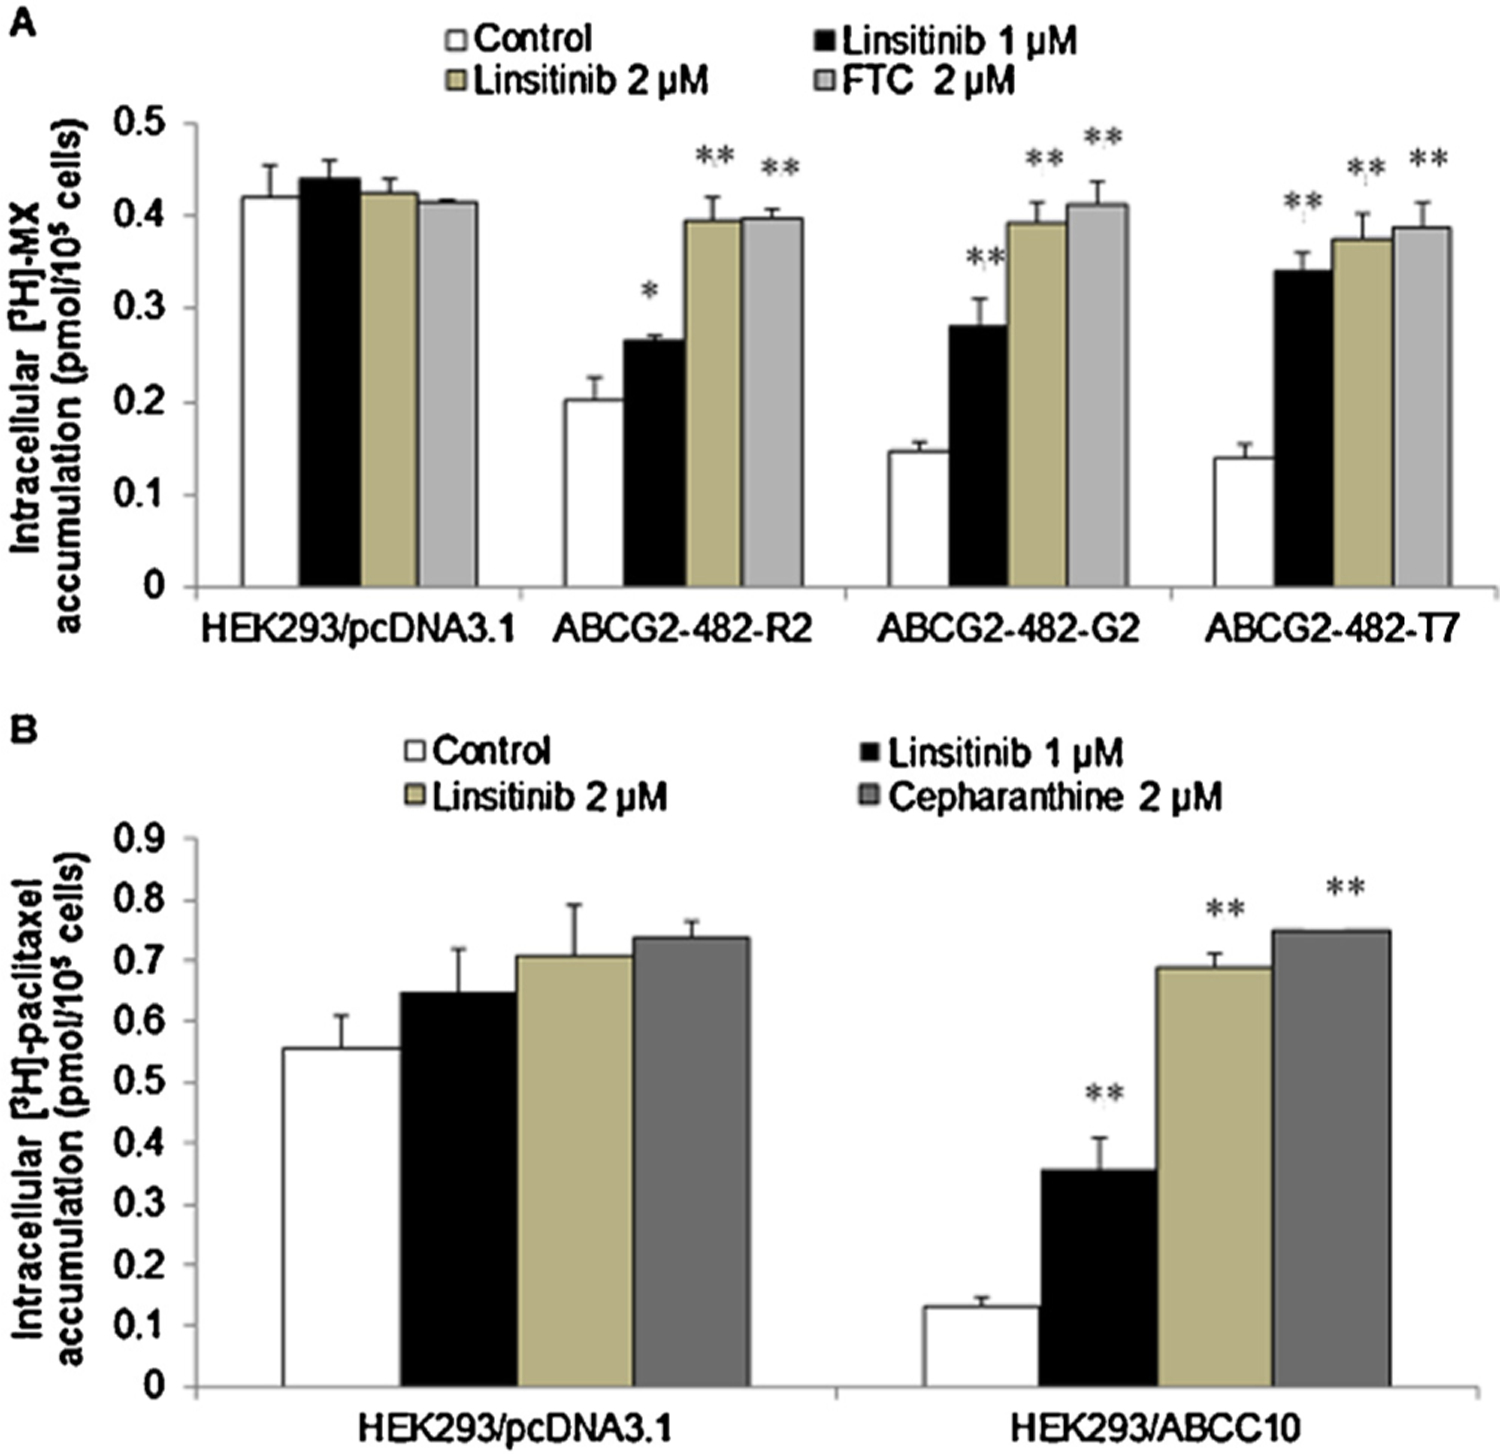
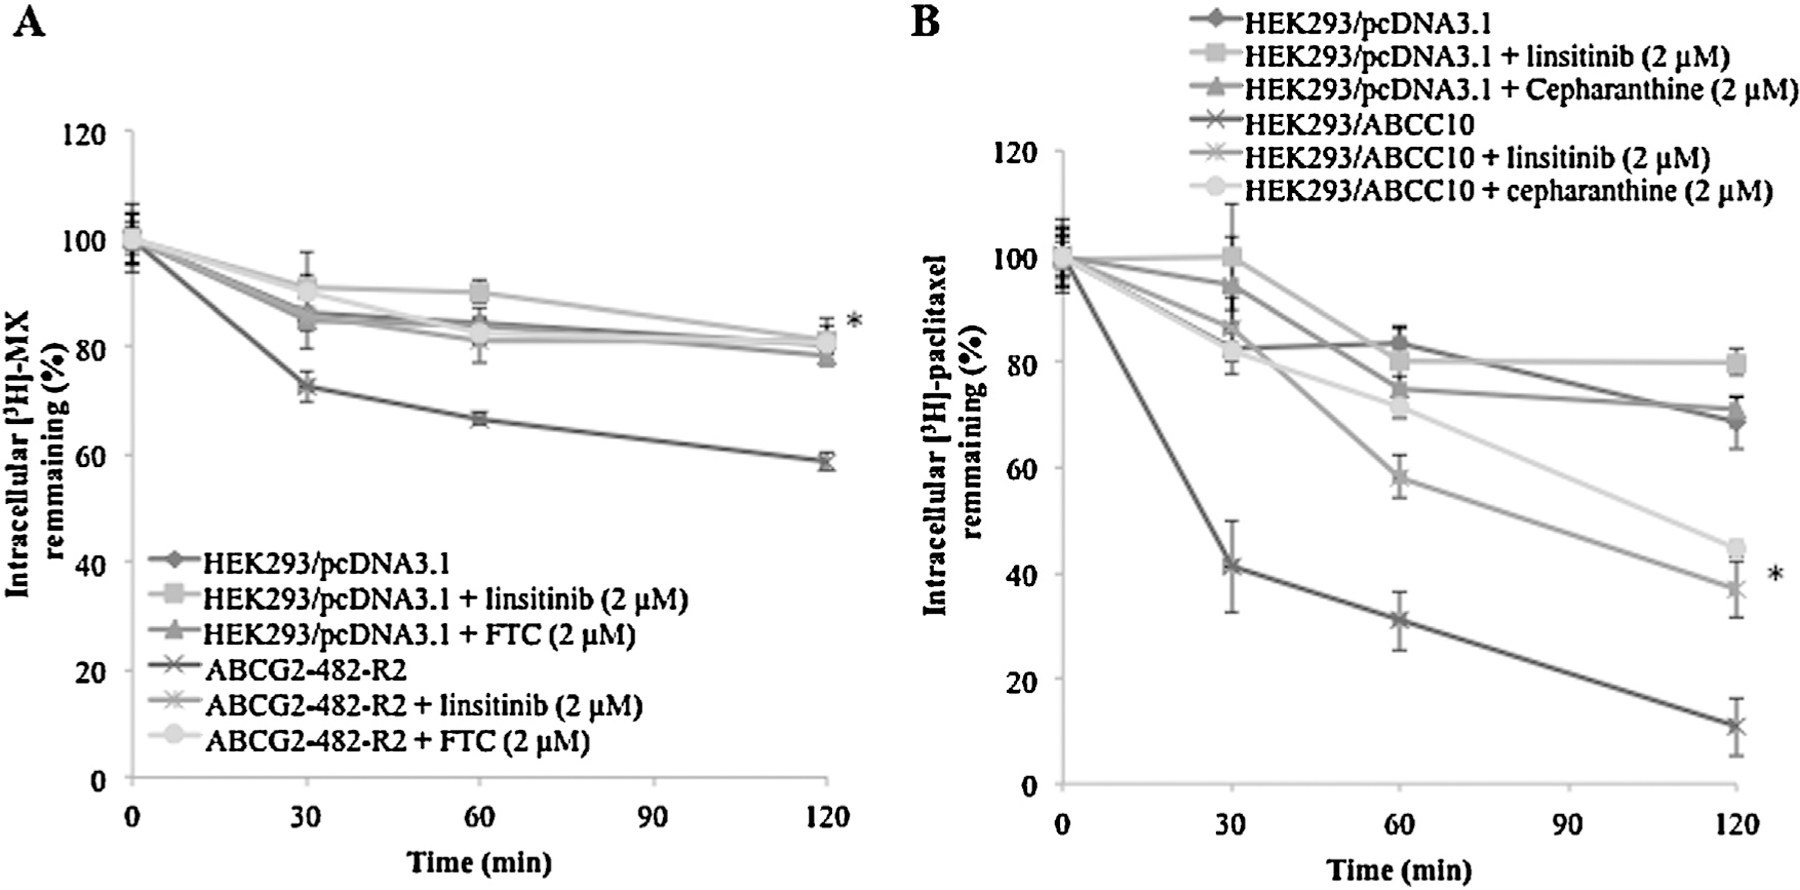
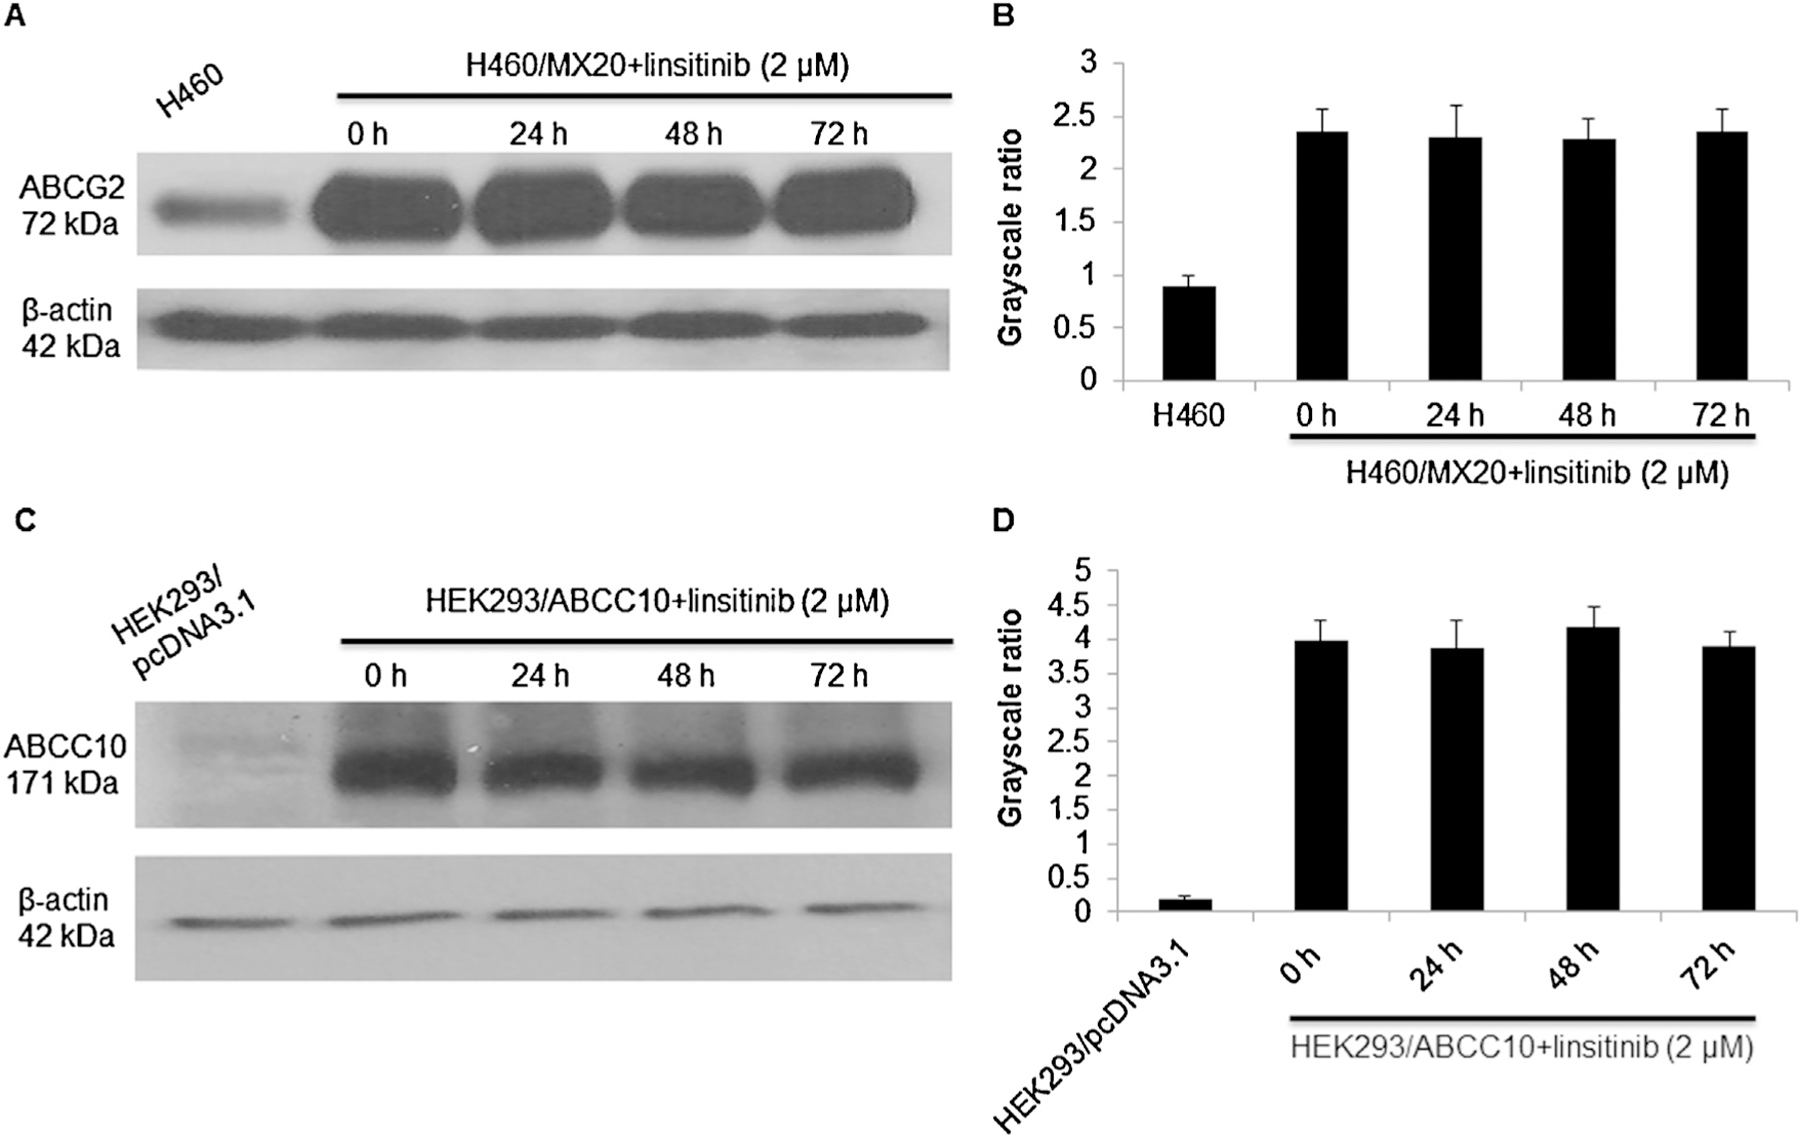
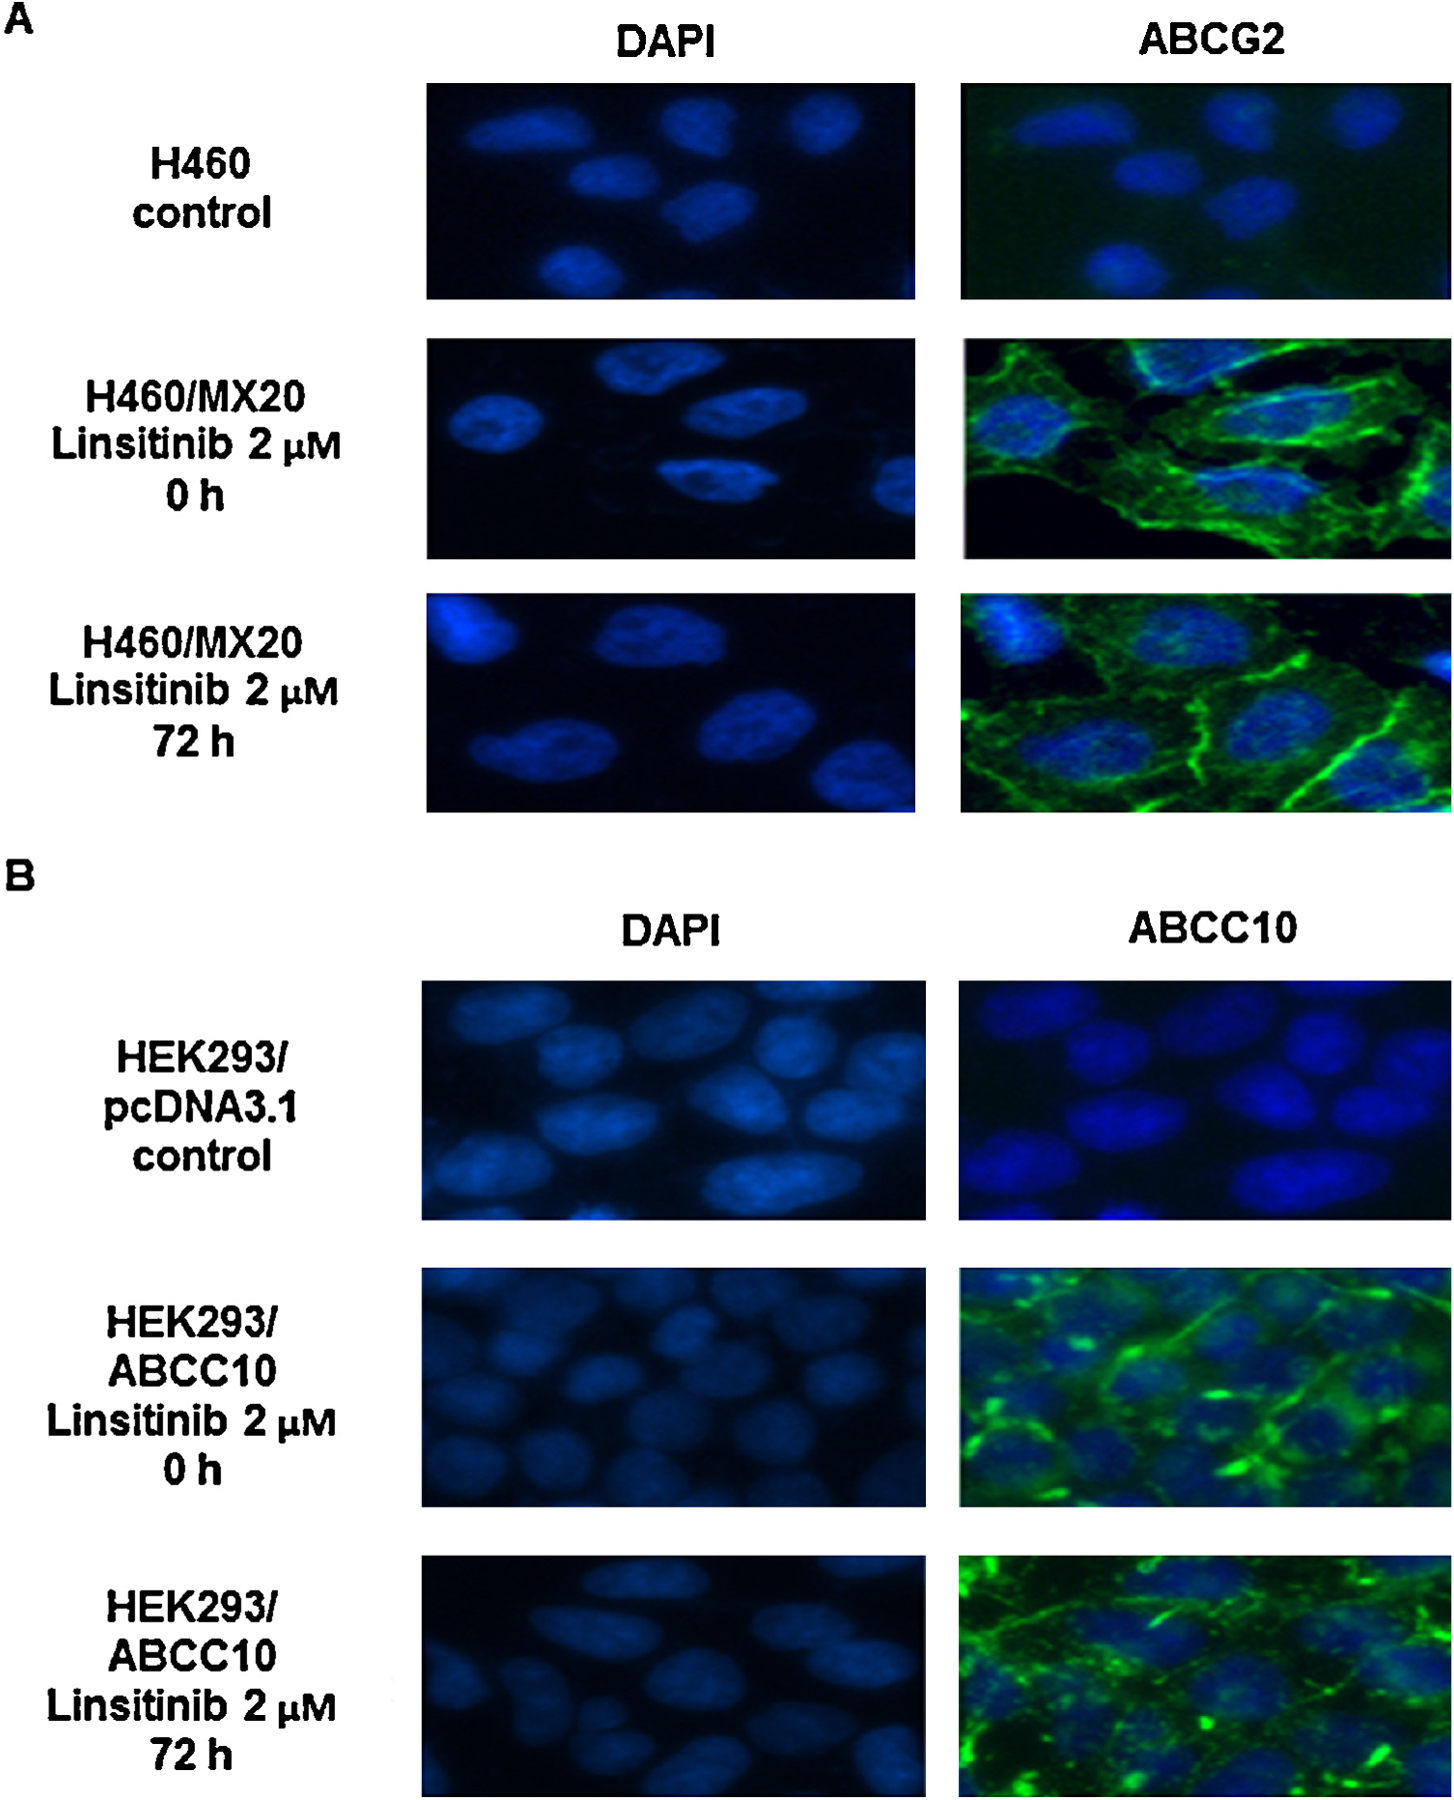
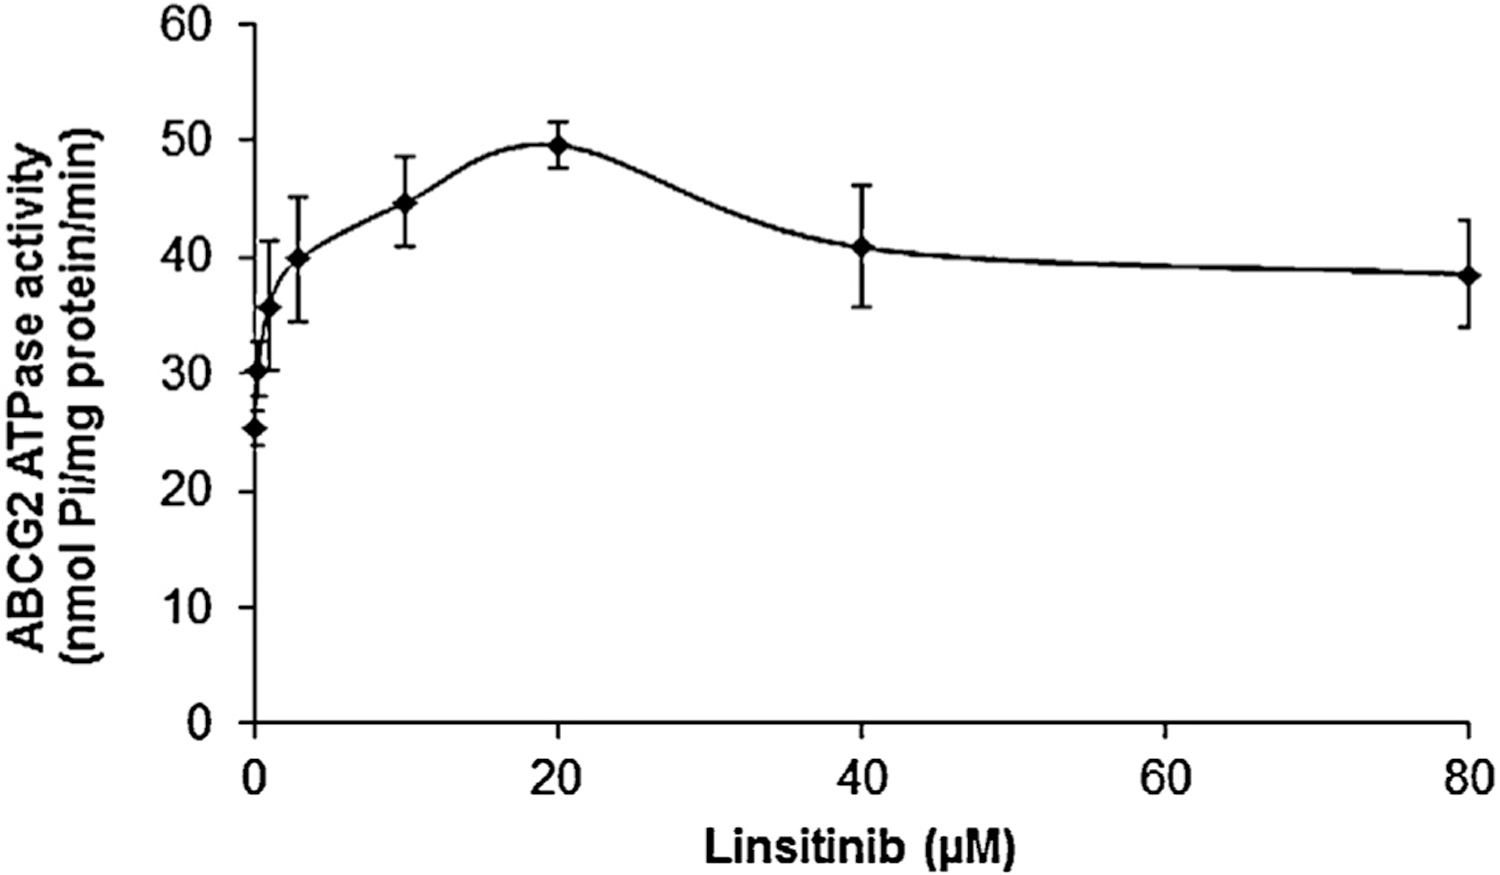
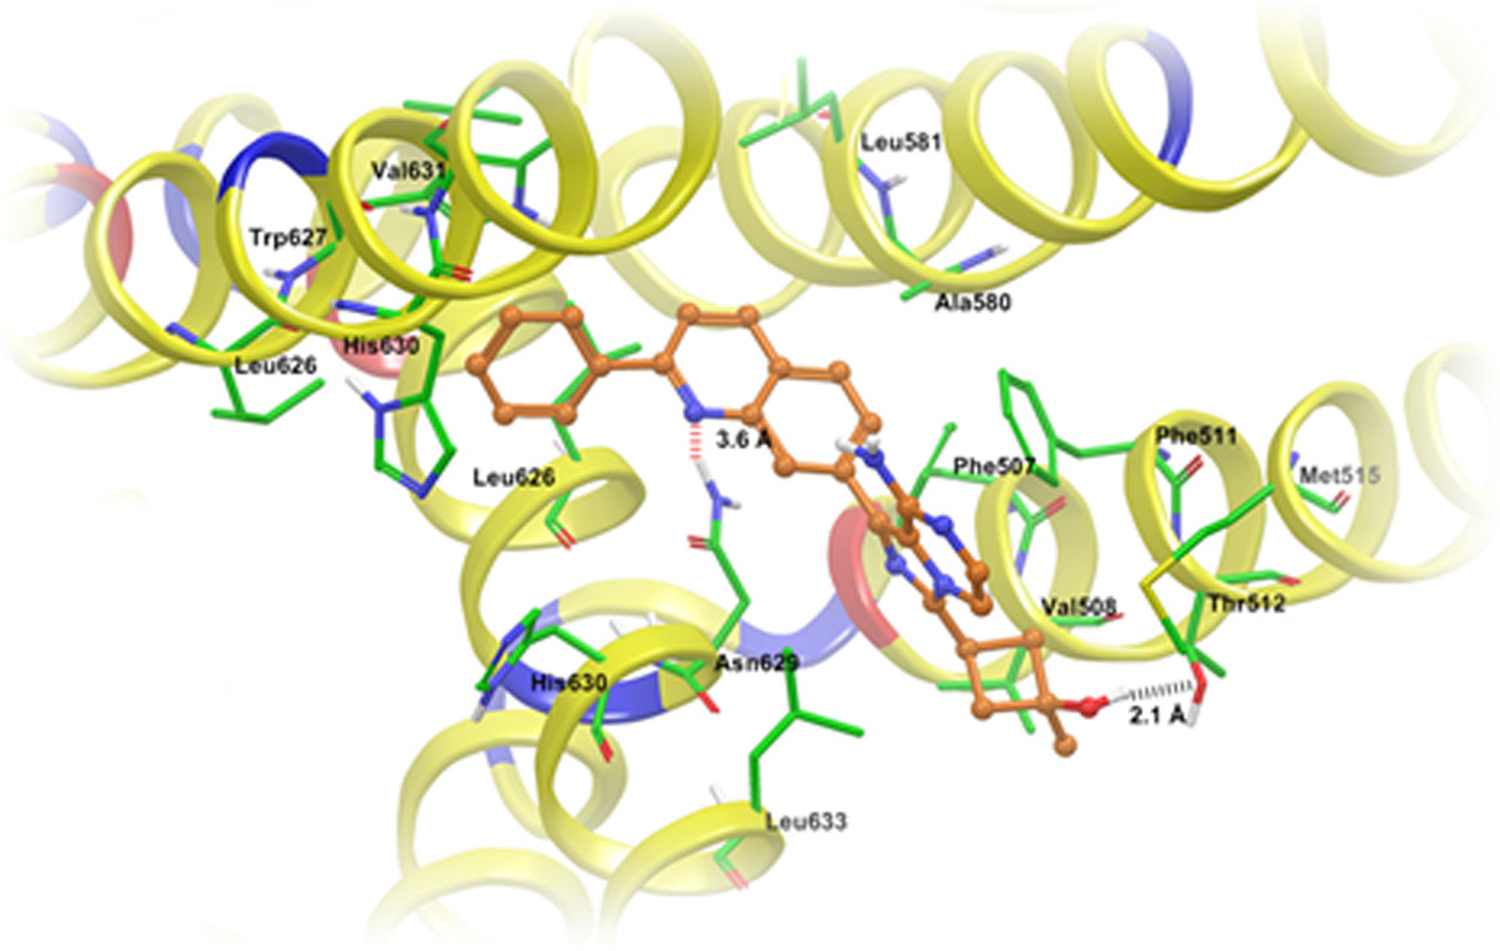
In this study we investigated the effect of linsitinib on the reversal of multidrug resistance (MDR) mediated by the overexpression of the ATP-binding cassette (ABC) subfamily members ABCB1, ABCG2, ABCC1 and ABCC10. Our results indicate for the first time that linsitinib significantly potentiate the effect of anti-neoplastic drugs mitoxantrone (MX) and SN-38 in ABCG2-overexpressing cells; paclitaxel, docetaxel and vinblastine in ABCC10-overexpressing cells. Linsitinib moderately enhanced the cytotoxicity of vincristine in cell lines overexpressing ABCB1, whereas it did not alter the cytotoxicity of substrates of ABCC1. Furthermore, linsitinib significantly increased the intracellular accumulation and decreased the efflux of [(3)H]-MX in ABCG2-overexpressing cells and [(3)H]-paclitaxel in ABCC10-overexpressing cells. However, linsitinib, at a concentration that reversed MDR, did not significantly alter the expression levels of either the ABCG2 or ABCC10 transporter proteins. Furthermore, linsitinib did not significantly alter the intracellular localization of ABCG2 or ABCC10. Moreover, linsitinib stimulated the ATPase activity of ABCG2 in a concentration-dependent manner. Overall, our study suggests that linsitinib attenuates ABCG2- and ABCC10-mediated MDR by directly inhibiting their function as opposed to altering ABCG2 or ABCC10 protein expression.
Keywords: ABCC10; ABCG2; Linsitinib; Multi-drug resistance; Tyrosine kinase inhibitor.
Published by Elsevier Ltd.
Conflict of interest statement
Conflict of interest
No potential conflicts of interest were disclosed.
Figures
Similar articles
-
Selonsertib (GS-4997), an ASK1 inhibitor, antagonizes multidrug resistance in ABCB1- and ABCG2-overexpressing cancer cells.Cancer Lett. 2019 Jan;440-441:82-93. doi: 10.1016/j.canlet.2018.10.007. Epub 2018 Oct 10. Cancer Lett. 2019. PMID: 30315846 Free PMC article.
-
Voruciclib, a Potent CDK4/6 Inhibitor, Antagonizes ABCB1 and ABCG2-Mediated Multi-Drug Resistance in Cancer Cells.Cell Physiol Biochem. 2018;45(4):1515-1528. doi: 10.1159/000487578. Epub 2018 Feb 19. Cell Physiol Biochem. 2018. PMID: 29486476
-
Lapatinib (Tykerb, GW572016) reverses multidrug resistance in cancer cells by inhibiting the activity of ATP-binding cassette subfamily B member 1 and G member 2.Cancer Res. 2008 Oct 1;68(19):7905-14. doi: 10.1158/0008-5472.CAN-08-0499. Cancer Res. 2008. PMID: 18829547 Free PMC article.
-
Multidrug resistance in cancer chemotherapy and xenobiotic protection mediated by the half ATP-binding cassette transporter ABCG2.Curr Med Chem Anticancer Agents. 2004 Jan;4(1):31-42. doi: 10.2174/1568011043482205. Curr Med Chem Anticancer Agents. 2004. PMID: 14754410 Review.
-
The association of ABC proteins with multidrug resistance in cancer.Biochim Biophys Acta Mol Cell Res. 2025 Feb;1872(2):119878. doi: 10.1016/j.bbamcr.2024.119878. Epub 2024 Nov 20. Biochim Biophys Acta Mol Cell Res. 2025. PMID: 39571941 Review.
Cited by
-
IGF-1/IGF-1R/FAK/YAP Transduction Signaling Prompts Growth Effects in Triple-Negative Breast Cancer (TNBC) Cells.Cells. 2020 Apr 18;9(4):1010. doi: 10.3390/cells9041010. Cells. 2020. PMID: 32325700 Free PMC article.
-
Thiazole-valine peptidomimetic (TTT-28) antagonizes multidrug resistance in vitro and in vivo by selectively inhibiting the efflux activity of ABCB1.Sci Rep. 2017 Feb 9;7:42106. doi: 10.1038/srep42106. Sci Rep. 2017. PMID: 28181548 Free PMC article.
-
Regorafenib overcomes chemotherapeutic multidrug resistance mediated by ABCB1 transporter in colorectal cancer: In vitro and in vivo study.Cancer Lett. 2017 Jun 28;396:145-154. doi: 10.1016/j.canlet.2017.03.011. Epub 2017 Mar 14. Cancer Lett. 2017. PMID: 28302530 Free PMC article.
-
2-Trifluoromethyl-2-Hydroxypropionamide Derivatives as Novel Reversal Agents of ABCG2 (BCRP)-Mediated Multidrug Resistance: Synthesis and Biological Evaluations.J Cell Biochem. 2017 Aug;118(8):2420-2429. doi: 10.1002/jcb.25908. Epub 2017 Apr 25. J Cell Biochem. 2017. PMID: 28120346 Free PMC article.
-
Repositioning of Tyrosine Kinase Inhibitors as Antagonists of ATP-Binding Cassette Transporters in Anticancer Drug Resistance.Cancers (Basel). 2014 Sep 29;6(4):1925-52. doi: 10.3390/cancers6041925. Cancers (Basel). 2014. PMID: 25268163 Free PMC article. Review.
References
-
- Ambudkar SV. Drug-stimulatable ATPase activity in crude membranes of human MDR1-transfected mammalian cells. Methods Enzymol 1998;292:504–14. - PubMed
-
- Bradford MM. A rapid and sensitive method for the quantitation of microgram quantities of protein utilizing the principle of protein-dye binding. Anal Biochem 1976;72:248–54. - PubMed
-
- Chen ZS, Robey RW, Belinsky MG, Shchaveleva I, Ren XQ, Sugimoto Y, et al. Transport of methotrexate, methotrexate polyglutamates, and 17beta-estradiol 17-(beta-D-glucuronide) by ABCG2: effects of acquired mutations at R482 on methotrexate transport. Cancer Res 2003;63:4048–54. - PubMed
Publication types
MeSH terms
Substances
Grants and funding
LinkOut - more resources
Full Text Sources
Other Literature Sources
Medical
