. 2014 Jul;147(1):221-232.e7.
doi: 10.1053/j.gastro.2014.04.003. Epub 2014 Apr 12.

Loss of CD28 expression by liver-infiltrating T cells contributes to pathogenesis of primary sclerosing cholangitis

Affiliations

Loss of CD28 expression by liver-infiltrating T cells contributes to pathogenesis of primary sclerosing cholangitis

Evaggelia Liaskou et al. Gastroenterology. 2014 Jul.

Abstract

Background & aims: T-cell-mediated biliary injury is a feature of primary sclerosing cholangitis (PSC). We studied the roles of CD28(-) T cells in PSC and their regulation by vitamin D.

Methods: Peripheral and liver-infiltrating mononuclear cells were isolated from blood or fresh liver tissue. We analyzed numbers, phenotypes, functions, and localization patterns of CD28(-) T cells, along with their ability to activate biliary epithelial cells. We measured levels of tumor necrosis factor (TNF)α in liver tissues from patients with PSC and the effects of exposure to active vitamin D (1,25[OH]2D3) on expression of CD28.

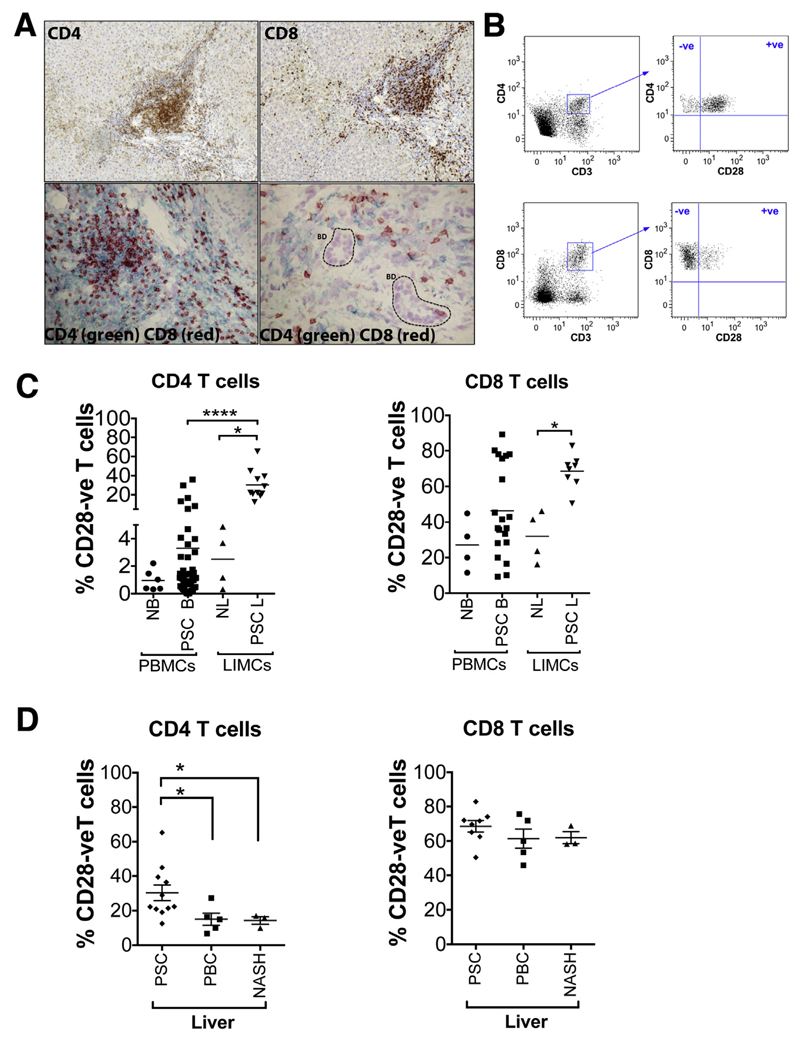
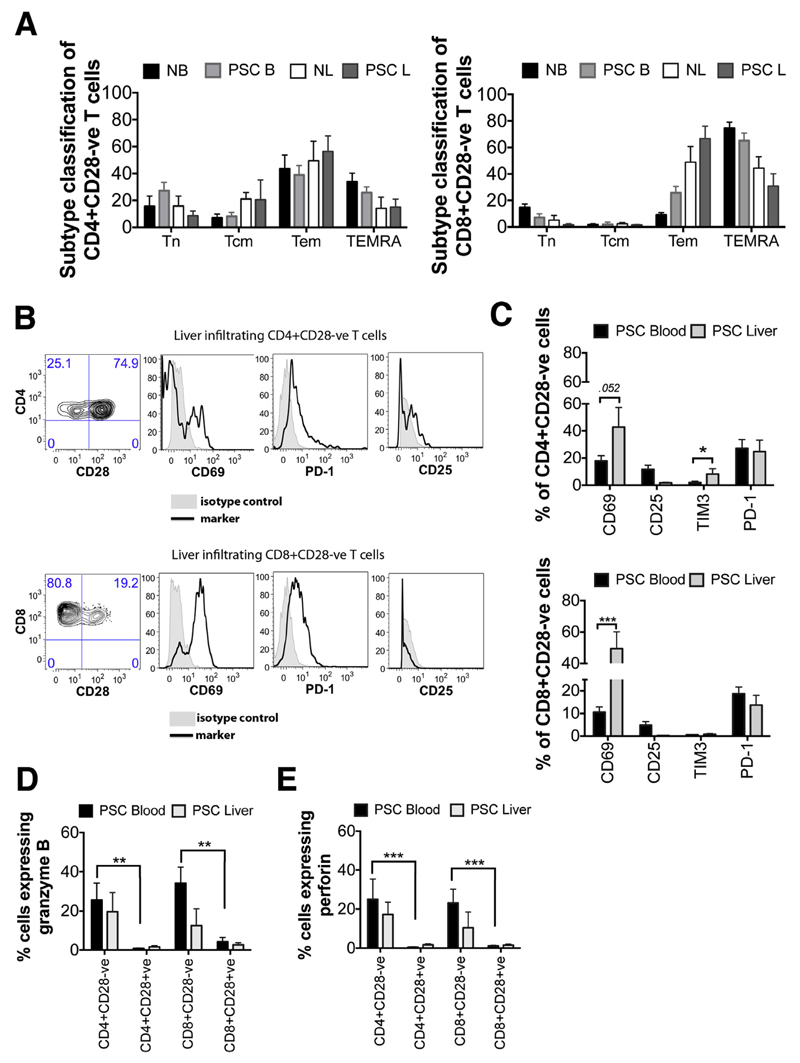
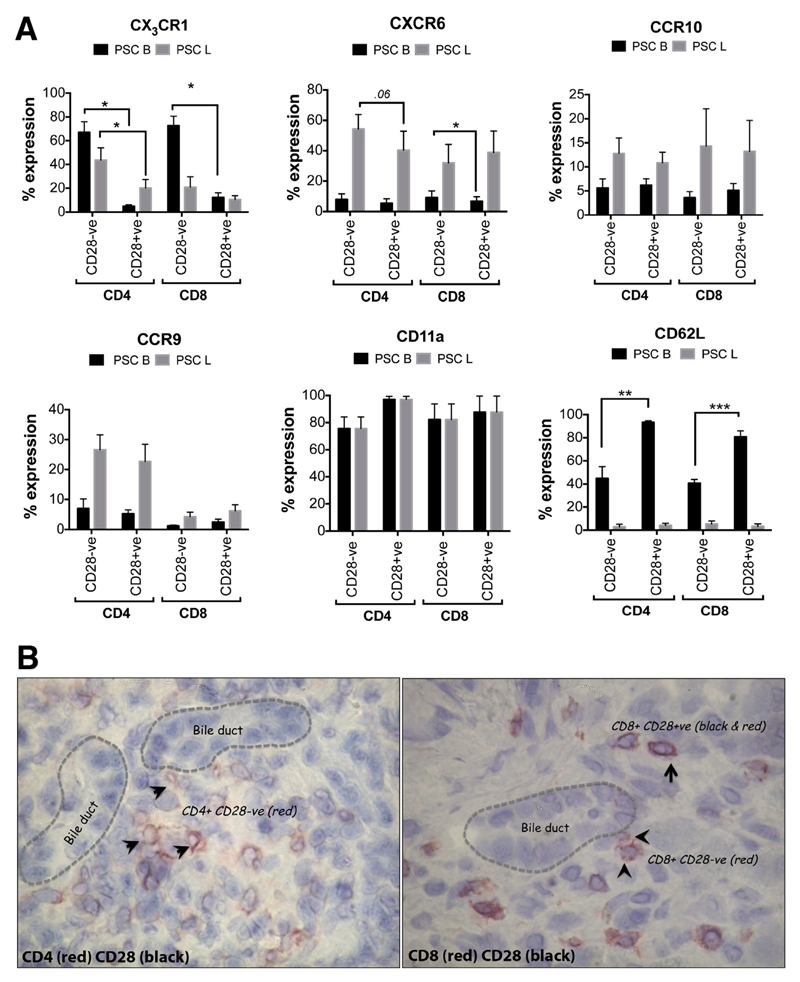
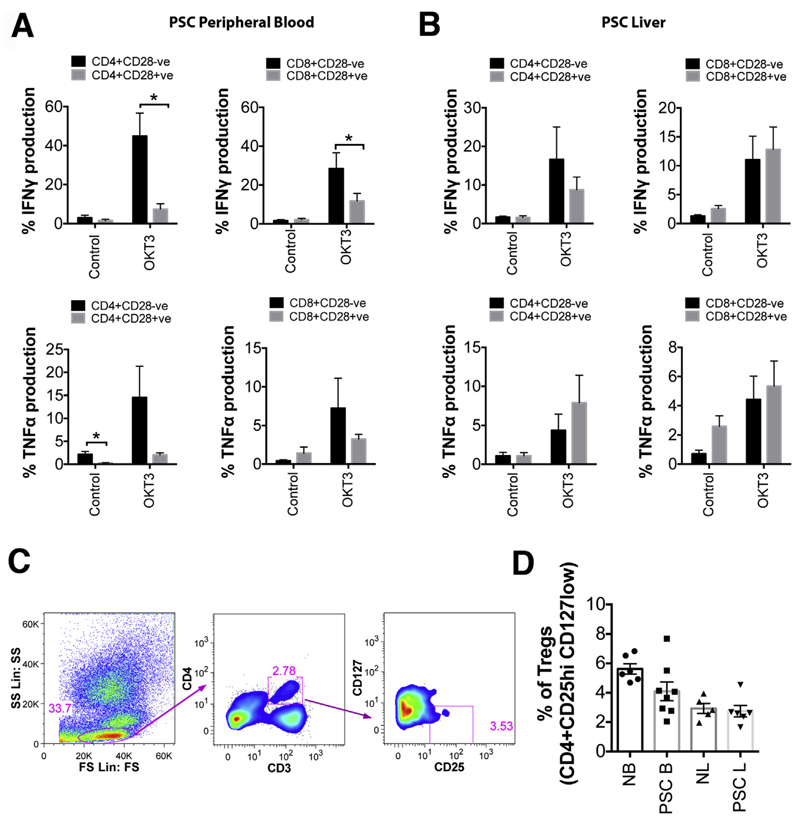
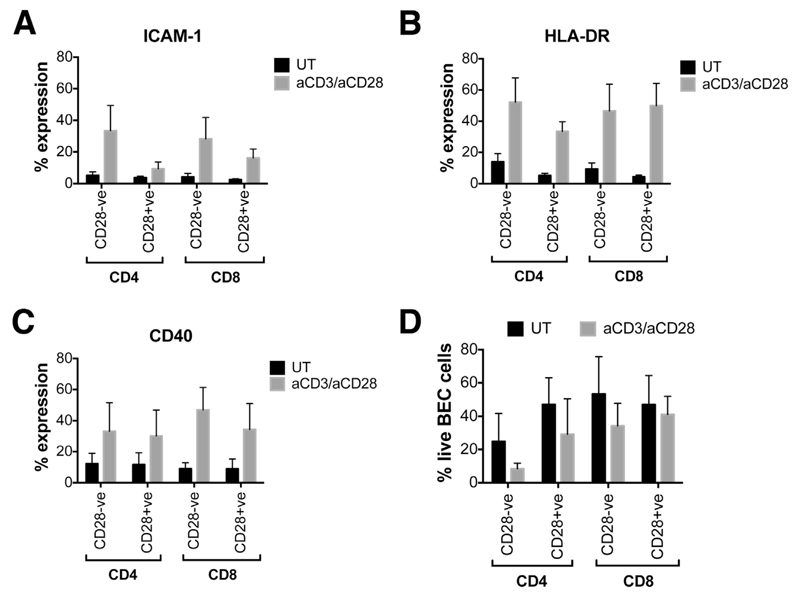
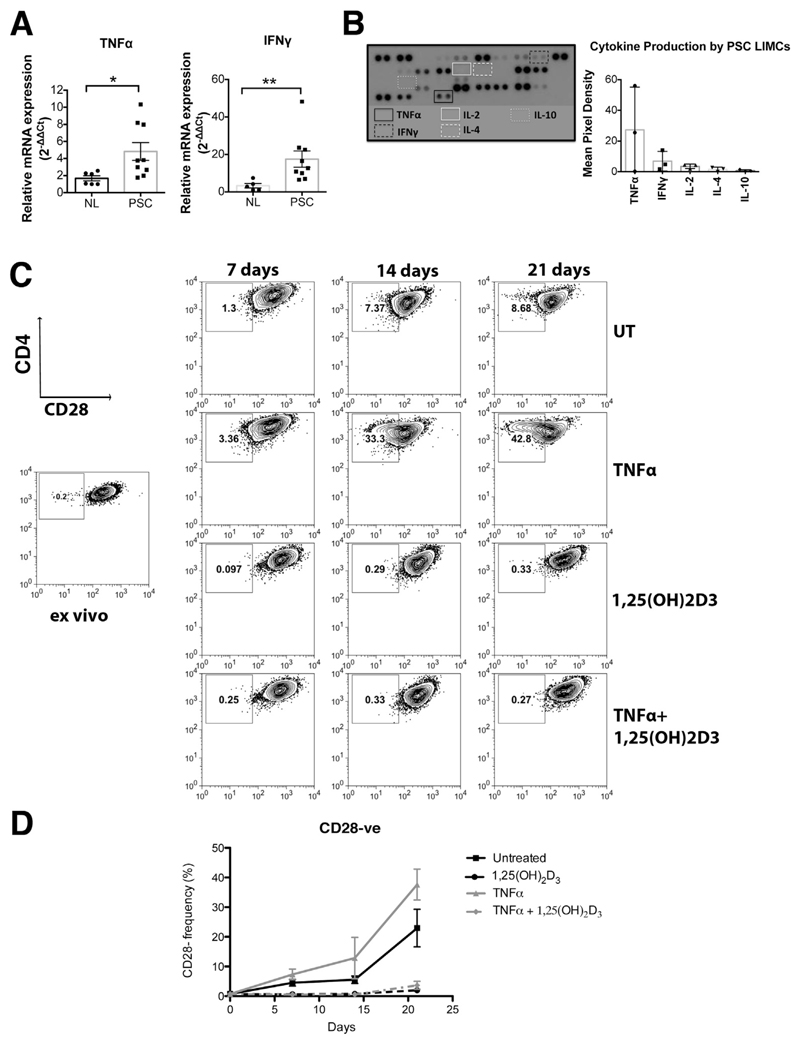
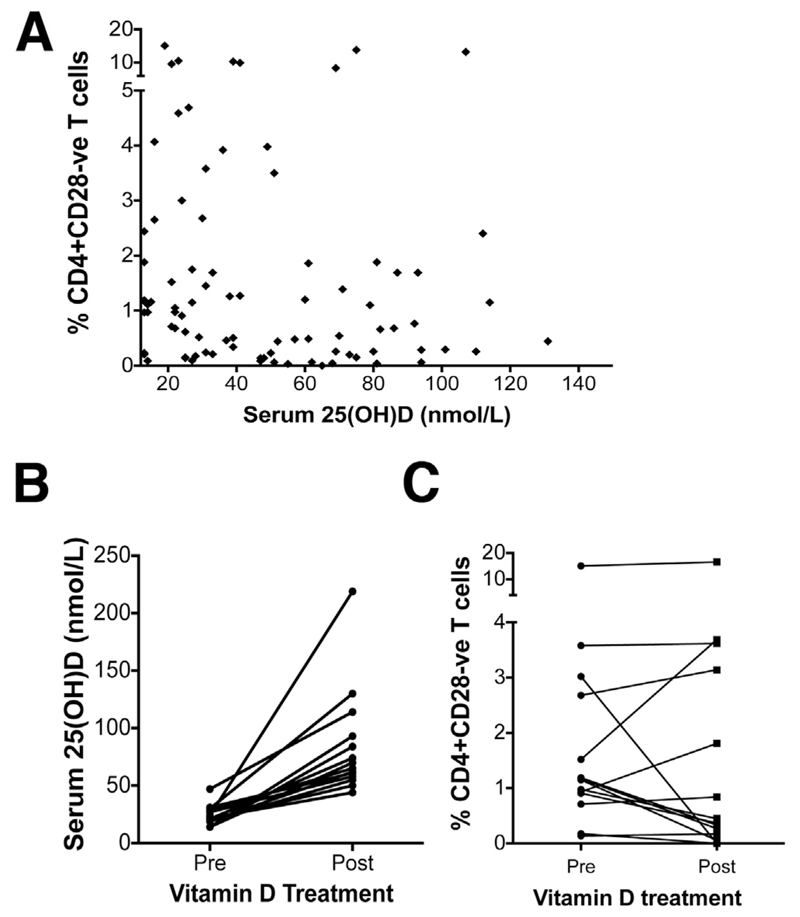
Results: A significantly greater proportion of CD4(+) and CD8(+) T cells that infiltrated liver tissues of patients with PSC were CD28(-), compared with control liver tissue (CD4(+): 30.3% vs 2.5%, P < .0001; and CD8(+): 68.5% vs 31.9%, P < .05). The mean percentage of CD4(+)CD28(-) T cells in liver tissues from patients with PSC was significantly higher than from patients with primary biliary cirrhosis or nonalcoholic steatohepatitis (P < .05). CD28(-) T cells were activated CD69(+)CD45RA(-) C-C chemokine receptor (CCR)7(-) effector memory and perforin(+) granzyme B(+) cytotoxic cells, which express CD11a, CX3CR1, C-X3-C motif receptor 6 (CXCR6), and CCR10-consistent with their infiltration of liver and localization around bile ducts. Compared with CD28(+) T cells, activated CD28(-) T cells produced significantly higher levels of interferon γ and TNFα (P < .05), and induced up-regulation of intercellular cell adhesion molecule-1, HLA-DR, and CD40 by primary epithelial cells (3.6-fold, 1.5-fold, and 1.2-fold, respectively). Liver tissue from patients with PSC contained high levels of TNFα; TNFα down-regulated the expression of CD28 by T cells in vitro (P < .01); this effect was prevented by administration of 1,25(OH)2D3 (P < .05).

Conclusions: Inflammatory CD28(-) T cells accumulate in livers of patients with PSC and localize around bile ducts. The TNFα-rich microenvironment of this tissue promotes inflammation; these effects are reversed by vitamin D in vitro.

Keywords: Autoimmunity; Biliary Epithelial Cells; Immune Regulation; Interferon.


Conflict of interest statement

Conflicts of interest

The authors disclose no conflicts.

Figures

Figure 1
Figure 1
CD28- T cells are more frequent in human PSC liver. (A) Single-color (magnification, 200×) and dual-color immunohistochemistry (CD4 [green] and CD8 [red]; 200× and 400×, respectively) showing localization of CD4+ and CD8+ T cells in human PSC liver tissue. BD, bile duct. (B) Representative flow cytometry dot plots showing the gating strategy defining CD28- T cells. (C) The frequency of CD3+CD4+CD28- and CD3+CD8+CD28- T cells in human PSC blood (n = 50 and n = 20, respectively) and liver (n = 11 and n = 8, respectively) was analyzed by flow cytometry and compared with blood (n = 6 and n = 4, respectively) and liver of healthy controls (n = 4, both). *P < .05, ****P < .0001. The ratio of CD4+CD28- T cells in PSC LIMCs:PBMCs was 9:1 and in normal LIMCs:PBMCs was 3:1. The ratio of CD8+CD28- T cells in PSC LIMCs:PBMCs was 1.4:1 and in normal LIMCs:PBMCs was 1:1. (D) The frequency of CD3+CD4+CD28- and CD3+CD8+CD28- T cells was analyzed in human PSC liver (n = 11 and n = 8, respectively) and compared with PBC (n = 5) and NASH (n = 3) human livers. *P < .05. NB, normal blood; NL, normal liver; PSC B, PSC blood; PSC L, PSC liver.
Figure 2
Figure 2. Phenotypic characterization of CD28- T cells in blood and liver of PSC patients.
(A) The expression of CD45RA and CCR7 on CD4+CD28- and CD8+CD28- T cells was analyzed by flow cytometry for normal blood (NB) PBMCs (n = 4), PSC blood (PSC B) PBMCs (n = 14), normal liver (NL) LIMCs (n = 4), and PSC liver (PSC L) LIMCs (n = 4). Cells were classified into naive (CD45RA+CCR7+; T naive [Tn]), central memory (CD45RA-CCR7+; T central memory [Tcm]), effector memory (CD45RA-CCR7; T effector memory [Tem]), and terminally differentiated effector memory RA (CD45RA+CCR7-; terminally differentiated effector memory RA [TEMRA]) populations. (B) CD3+CD4+ and CD3+CD8+ cells were selected and CD28- T cells gated as shown in the representative contour plots were analyzed for CD69, programmed cell-death 1 (PD-1), CD25, and TIM3 expression. Representative histograms for the marker (solid line) and its isotype control (shaded area) are shown. (C) Data show the percentage (mean ± SEM) of CD4+CD28- and CD8+CD28- T cells expressing CD69 (n = 23 [blood] and n = 6 [liver]), CD25 (n = 22 [blood] and n = 7 [liver]), TIM3 (n = 14 [blood] and n = 5 [liver]), and PD-1 (n = 14 [blood] and n = 6 [liver]). *P < .05, ***P < .001. (D and E) CD28- and CD28+ T lymphocytes from PSC PBMCs (n = 9) and LIMCs (n = 5) were analyzed by flow cytometry for the presence of intracellular deposits of granzyme B and perforin. **P < .01, ***P < .001.
Figure 3
Figure 3
CD28- T cells are equipped with adhesion molecules and chemokine receptors that promote tissue infiltration and localization close to the bile ducts. (A) The expression of chemokine receptors CX3CR1 (n = 7 [blood] and n = 6 [liver]), CXCR6 (n = 7 [blood] and n = 6 [liver]), CCR9 (n = 4 [blood] and n = 5 [liver]), and CCR10 (n = 9 [blood] and n = 5 [liver]), and adhesion molecules CD11a (n = 4 [blood] and n = 4 [liver]), and CD62L (n = 7 [blood] and n = 3 [liver]) on CD28- and CD28+ T cells of CD4+ and CD8+ T cells from blood (PSC B) and liver (PSC L) of PSC patients was analyzed using flow cytometry. Data show the percentages of CD28- and CD28+ T cells that express the chemokine receptors. *P < .05, **P < .01, ***P < .001. (B) Representative dual-color immunohistochemistry image showing the localization of CD4+CD28- and CD8+CD28- T cells in human PSC liver tissue (magnification, 400×). Arrowheads point to CD28- ve T cells in red and arrows point to CD28+ T cells in black and red.
Figure 4
Figure 4
CD28- T cells release proinflammatory cytokines and their supernatants are able to activate human primary BECs in vitro. Data from (A) 6 PSC peripheral blood samples and (B) 6 PSC liver samples showing TNFα and IFNγ production by CD4+CD28+/- and CD8+CD28+/-. *P < .05. (C) Representative flow cytometry plots showing the gating strategy for defining T-regulatory cells. (D) Data show the percentage of CD3+CD4+ T cells that are CD25hi CD127low, in blood and liver of normal and PSC patients (normal blood [NB], n = 6; PSC blood [PSC B], n = 8; normal liver [NL], n = 5; PSC liver [PSC L], n = 6). Each shape represents the value from each individual, and the line represents the mean value ± SEM.
Figure 5
Figure 5
Supernatants from CD28- T cells are able to activate human primary BECs in vitro. (AC) Data show the indirect effects of untreated (UT) and aCD3-/aCD28-treated, cell-sorted CD28- and CD28+ T cells on the percentage expression of ICAM1, HLA-DR, and CD40 (n = 5) on BECs. (D) Data show the percentage of live BECs after 4 days of coculture with the T-cell–conditioned media (n = 3).
Figure 6
Figure 6
TNFα enhances the emergence of CD28- T cells and 1,25(OH)2D3 overcomes this effect. (A) TNFα and IFNγ messenger RNA (mRNA) expression in 6 normal liver (NL) and 9 PSC liver tissues was measured by quantitative polymerase chain reaction. Scatter dot plots show relative mRNA levels in diseased livers with respect to 1 NL tissue (mean ± SEM). *P < .05, **P < .01. (B) Cytokines and chemokines released from 3 PSC LIMCs as analyzed with the Human Cytokine Array kit (R&D Systems, Abingdon, United Kingdom). Expression levels are reported as mean pixel density in arbitrary units. (C) CD4+ T cells from blood of PSC patients were stimulated with aCD3/aCD28 beads and cultured for 21 days in the presence or absence of TNFα, with or without 1,25(OH)2D3. The frequency of CD28- cells was measured at 0, 7, 14, and 21 days by flow cytometry as shown in the representative contour plots. (D) Data from 7 donors.
Figure 7
Figure 7
CD4+CD28- T cells in PSC patients supplemented with vitamin D. (A) Serum 25(OH)D levels of 92 PSC patients were correlated with the frequency of CD4+CD28- T cells in circulation. Each dot represents the value from each individual. (B) PSC patients who had insufficient serum vitamin D levels were supplemented with vitamin D as part of their medical treatment. The levels of serum 25(OH) vitamin D before and after supplementation are shown. (C) Data show the percentage of CD4+CD28- T cells after several weeks when serum vitamin D levels reached sufficiency. Data were analyzed using the Wilcoxon matched-pairs signed rank test (P = .669).

References

    1. Hirschfield GM, Karlsen TH, Lindor KD, et al. Primary sclerosing cholangitis. Lancet. 2013;382:1587–1599. - PubMed
    1. Liu JZ, Hov JR, Folseraas T, et al. Dense genotyping of immune-related disease regions identifies nine new risk loci for primary sclerosing cholangitis. Nat Genet. 2013;45:670–675. - PMC - PubMed
    1. Hashimoto E, Lindor KD, Homburger HA, et al. Immunohistochemical characterization of hepatic lymphocytes in primary biliary cirrhosis in comparison with primary sclerosing cholangitis and autoimmune chronic active hepatitis. Mayo Clin Proc. 1993;68:1049–1055. - PubMed
    1. Ponsioen CY, Kuiper H, Ten Kate FJ, et al. Immunohistochemical analysis of inflammation in primary sclerosing cholangitis. Eur J Gastroenterol Hepatol. 1999;11:769–774. - PubMed
    1. Bo X, Broome U, Remberger M, et al. Tumour necrosis factor alpha impairs function of liver derived T lymphocytes and natural killer cells in patients with primary sclerosing cholangitis. Gut. 2001;49:131–141. - PMC - PubMed

Publication types

MeSH terms