

The spectral diversity of resting-state fluctuations in the human brain
- PMID: 24728207
- PMCID: PMC3984093
- DOI: 10.1371/journal.pone.0093375
The spectral diversity of resting-state fluctuations in the human brain
Abstract
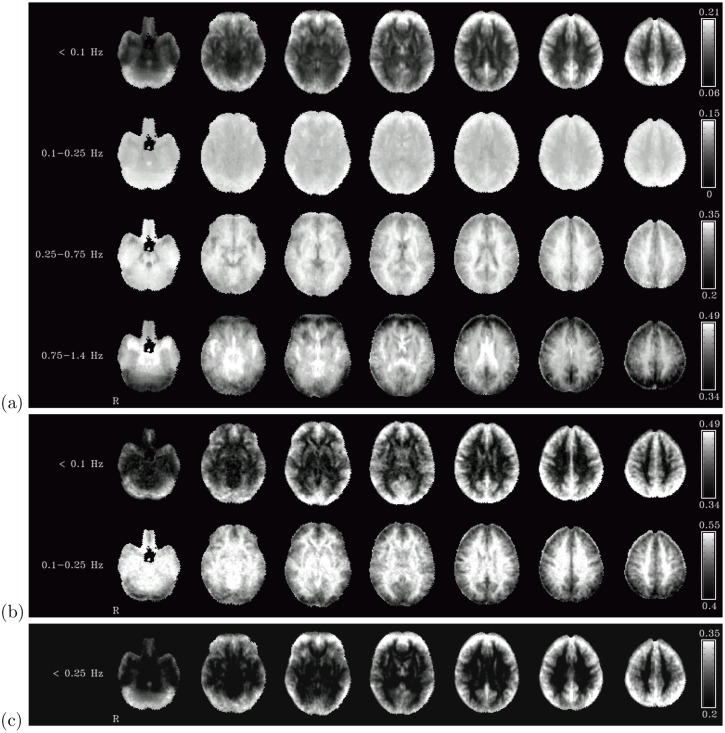
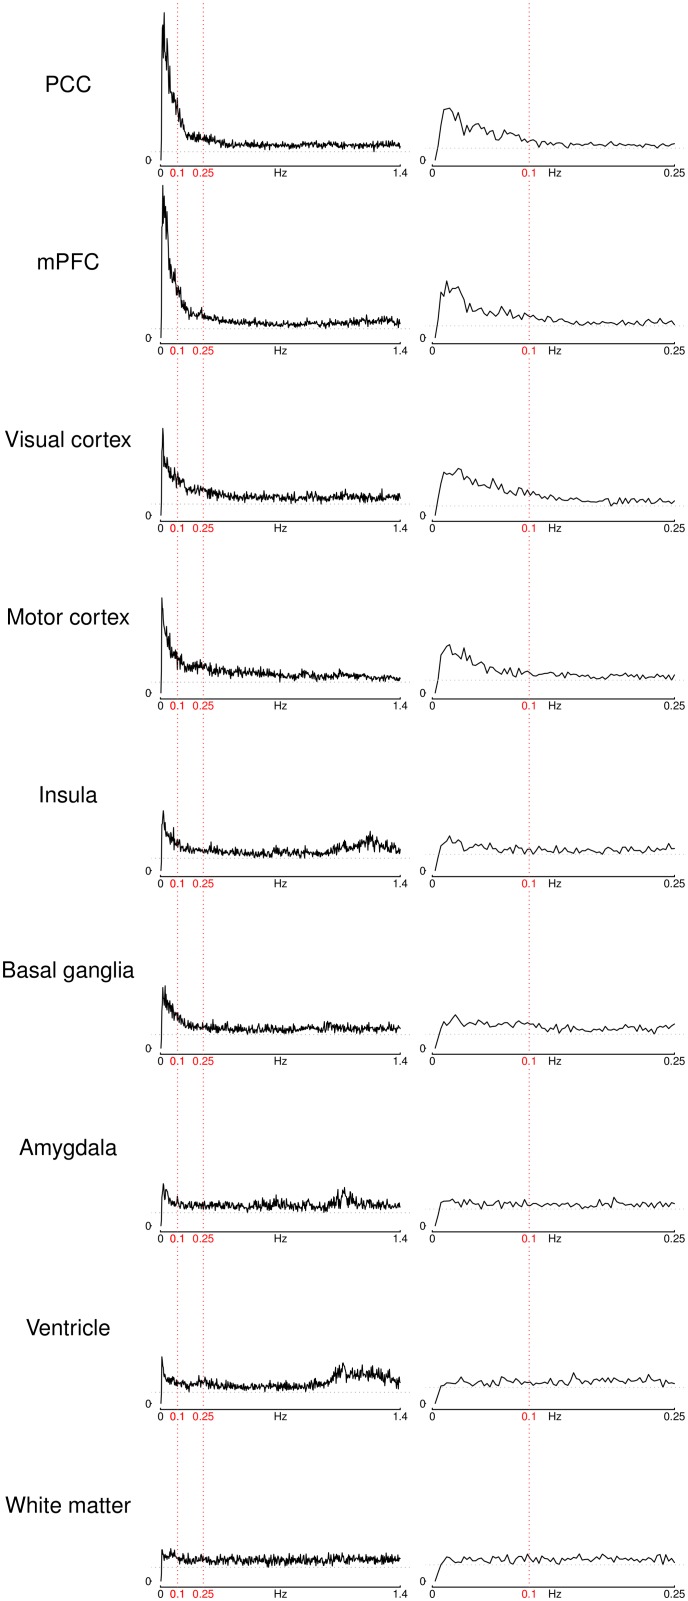
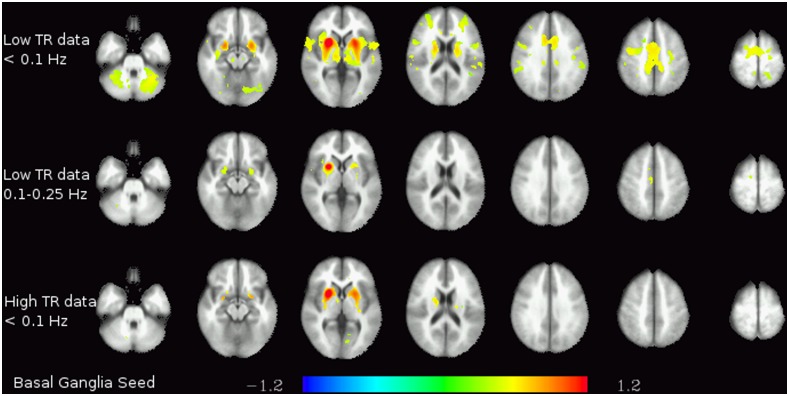
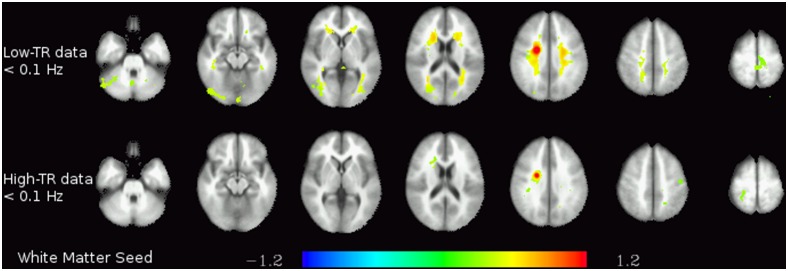
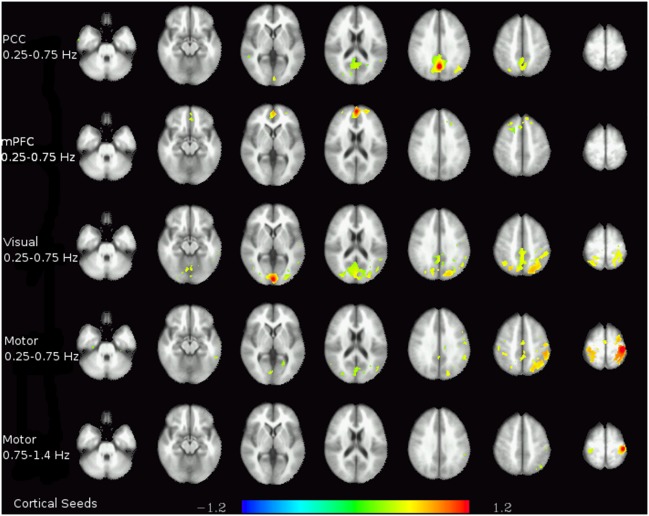
In order to assess whole-brain resting-state fluctuations at a wide range of frequencies, resting-state fMRI data of 20 healthy subjects were acquired using a multiband EPI sequence with a low TR (354 ms) and compared to 20 resting-state datasets from standard, high-TR (1800 ms) EPI scans. The spatial distribution of fluctuations in various frequency ranges are analyzed along with the spectra of the time-series in voxels from different regions of interest. Functional connectivity specific to different frequency ranges (<0.1 Hz; 0.1-0.25 Hz; 0.25-0.75 Hz; 0.75-1.4 Hz) was computed for both the low-TR and (for the two lower-frequency ranges) the high-TR datasets using bandpass filters. In the low-TR data, cortical regions exhibited highest contribution of low-frequency fluctuations and the most marked low-frequency peak in the spectrum, while the time courses in subcortical grey matter regions as well as the insula were strongly contaminated by high-frequency signals. White matter and CSF regions had highest contribution of high-frequency fluctuations and a mostly flat power spectrum. In the high-TR data, the basic patterns of the low-TR data can be recognized, but the high-frequency proportions of the signal fluctuations are folded into the low frequency range, thus obfuscating the low-frequency dynamics. Regions with higher proportion of high-frequency oscillations in the low-TR data showed flatter power spectra in the high-TR data due to aliasing of the high-frequency signal components, leading to loss of specificity in the signal from these regions in high-TR data. Functional connectivity analyses showed that there are correlations between resting-state signal fluctuations of distant brain regions even at high frequencies, which can be measured using low-TR fMRI. On the other hand, in the high-TR data, loss of specificity of measured fluctuations leads to lower sensitivity in detecting functional connectivity. This underlines the advantages of low-TR EPI sequences for resting-state and potentially also task-related fMRI experiments.
Conflict of interest statement
Figures
Similar articles
-
Beyond Noise: Using Temporal ICA to Extract Meaningful Information from High-Frequency fMRI Signal Fluctuations during Rest.Front Hum Neurosci. 2013 May 1;7:168. doi: 10.3389/fnhum.2013.00168. eCollection 2013. Front Hum Neurosci. 2013. PMID: 23641208 Free PMC article.
-
Low-frequency fluctuations in the cardiac rate as a source of variance in the resting-state fMRI BOLD signal.Neuroimage. 2007 Nov 1;38(2):306-20. doi: 10.1016/j.neuroimage.2007.07.037. Epub 2007 Aug 9. Neuroimage. 2007. PMID: 17869543 Free PMC article.
-
Functional brain hubs and their test-retest reliability: a multiband resting-state functional MRI study.Neuroimage. 2013 Dec;83:969-82. doi: 10.1016/j.neuroimage.2013.07.058. Epub 2013 Jul 27. Neuroimage. 2013. PMID: 23899725
-
Biophysical and neural basis of resting state functional connectivity: Evidence from non-human primates.Magn Reson Imaging. 2017 Jun;39:71-81. doi: 10.1016/j.mri.2017.01.020. Epub 2017 Feb 2. Magn Reson Imaging. 2017. PMID: 28161319 Free PMC article. Review.
-
Advances in resting state fMRI acquisitions for functional connectomics.Neuroimage. 2021 Nov;243:118503. doi: 10.1016/j.neuroimage.2021.118503. Epub 2021 Aug 31. Neuroimage. 2021. PMID: 34479041 Review.
Cited by
-
Spatial parcellations, spectral filtering, and connectivity measures in fMRI: Optimizing for discrimination.Hum Brain Mapp. 2019 Feb 1;40(2):407-419. doi: 10.1002/hbm.24381. Epub 2018 Sep 26. Hum Brain Mapp. 2019. PMID: 30259597 Free PMC article.
-
Enhanced subject-specific resting-state network detection and extraction with fast fMRI.Hum Brain Mapp. 2017 Feb;38(2):817-830. doi: 10.1002/hbm.23420. Epub 2016 Oct 3. Hum Brain Mapp. 2017. PMID: 27696603 Free PMC article.
-
Fractional amplitude of low-frequency fluctuations (fALFF) in post-stroke depression.Neuroimage Clin. 2017 Jul 18;16:116-124. doi: 10.1016/j.nicl.2017.07.014. eCollection 2017. Neuroimage Clin. 2017. PMID: 28794972 Free PMC article.
-
Spectral graph model for fMRI: a biophysical, connectivity-based generative model for the analysis of frequency-resolved resting state fMRI.bioRxiv [Preprint]. 2024 Mar 27:2024.03.22.586305. doi: 10.1101/2024.03.22.586305. bioRxiv. 2024. Update in: Imaging Neurosci (Camb). 2024 Dec 09;2:imag-2-00381. doi: 10.1162/imag_a_00381. PMID: 38586057 Free PMC article. Updated. Preprint.
-
Frequency modulation increases the specificity of time-resolved connectivity: A resting-state fMRI study.Netw Neurosci. 2024 Oct 1;8(3):734-761. doi: 10.1162/netn_a_00372. eCollection 2024. Netw Neurosci. 2024. PMID: 39355435 Free PMC article.
References
-
- Biswal B, Yetkin FZ, Haughton VM, Hyde JS (1995) Functional connectivity in the motor cortex of resting human brain using echo-planar MRI. Magn Reson Med 34: 537–541. - PubMed
-
- Aguirre GK, Zarahn E, D’esposito M (1998) The variability of human, BOLD hemodynamic responses. Neuroimage 8: 360–369. - PubMed
Publication types
MeSH terms
Grants and funding
LinkOut - more resources
Full Text Sources
Other Literature Sources
