. 2014 Apr 11;9(4):e94045.
doi: 10.1371/journal.pone.0094045. eCollection 2014.

Micro-environment causes reversible changes in DNA methylation and mRNA expression profiles in patient-derived glioma stem cells

Affiliations

Micro-environment causes reversible changes in DNA methylation and mRNA expression profiles in patient-derived glioma stem cells

Mehmet Baysan et al. PLoS One. .

Abstract

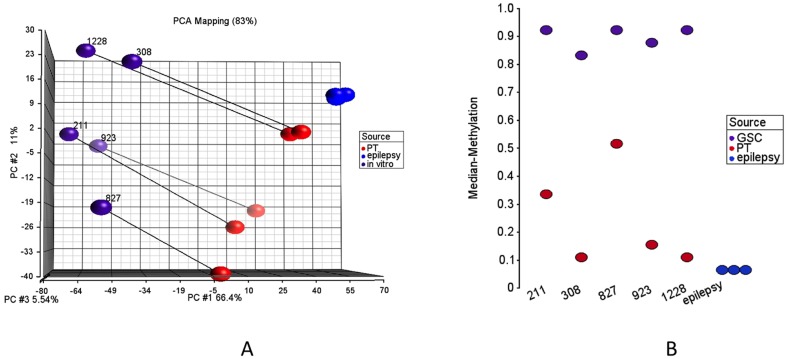
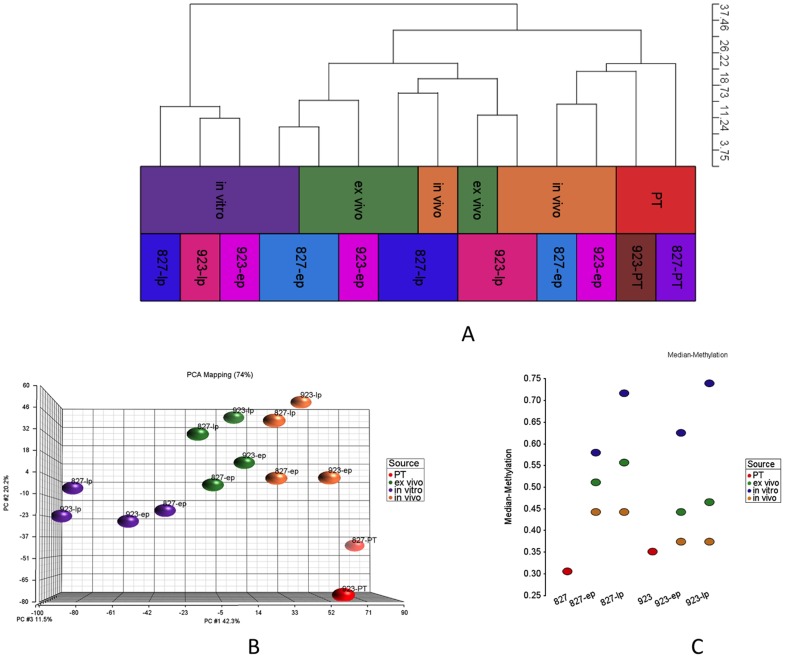
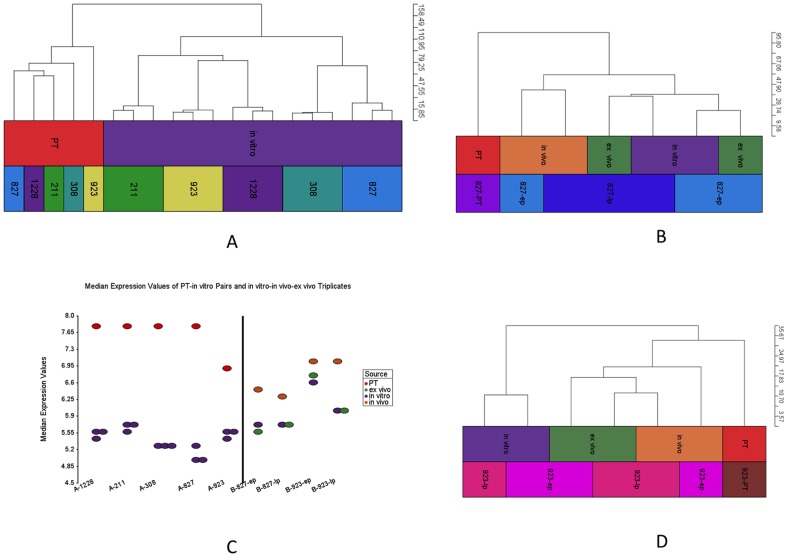
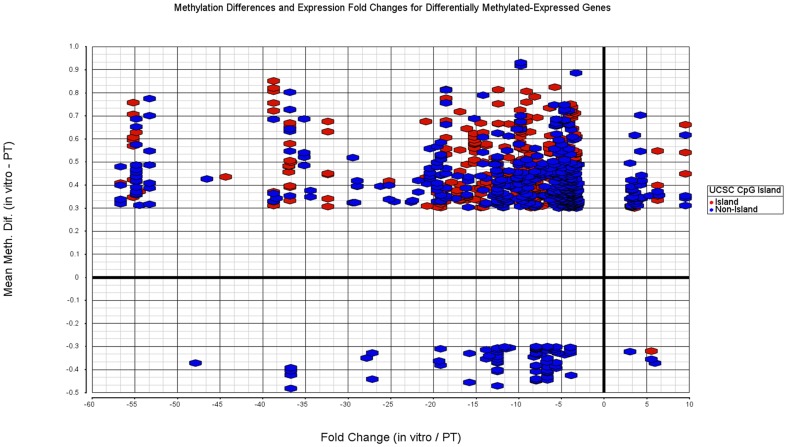
In vitro and in vivo models are widely used in cancer research. Characterizing the similarities and differences between a patient's tumor and corresponding in vitro and in vivo models is important for understanding the potential clinical relevance of experimental data generated with these models. Towards this aim, we analyzed the genomic aberrations, DNA methylation and transcriptome profiles of five parental tumors and their matched in vitro isolated glioma stem cell (GSC) lines and xenografts generated from these same GSCs using high-resolution platforms. We observed that the methylation and transcriptome profiles of in vitro GSCs were significantly different from their corresponding xenografts, which were actually more similar to their original parental tumors. This points to the potentially critical role of the brain microenvironment in influencing methylation and transcriptional patterns of GSCs. Consistent with this possibility, ex vivo cultured GSCs isolated from xenografts showed a tendency to return to their initial in vitro states even after a short time in culture, supporting a rapid dynamic adaptation to the in vitro microenvironment. These results show that methylation and transcriptome profiles are highly dependent on the microenvironment and growth in orthotopic sites partially reverse the changes caused by in vitro culturing.


Conflict of interest statement

Competing Interests: The authors have declared that no competing interests exist.

Figures

Figure 1
Figure 1. Copy number alterations for patient tumors and in vitro, in vivo, ex vivo GSC samples.
(A) Comparison of five matched patient tumors and their corresponding in vitro GSCs. Each line represents a sample. Three or four digit code represents GSC id, PT represents patient tumor and invitro represents in vitro GSC. Blue is amplification, red is deletion, purple is loss of heterozygosity and orange is allelic imbalance. Examples of the many differences between PTs and matched in vitro GSCs are loss on chromosome 13 at GSC-827 and gain on chromosomes 4, 8, 9 and 14 at GSC-1228. (B) Comparison of in vitro-in vivo-ex vivo triplicates for early and late passages of two GSCs.
Figure 2
Figure 2. DNA methylation profiles for patient tumors and in vitro GSCs.
(A) Principle Component Analyses (PCA) of 3847 methylation sites with standard deviation more than 0.35. PT represents patient tumor and in vitro represents the corresponding in vitro GSCs. Matched PT-in vitro pairs are connected with lines. (B) Median methylation values for each sample based on selected 3847 sites.
Figure 3
Figure 3. DNA methylation profiles of patient tumors and in vitro, in vivo, ex vivo GSCs for two cell lines.
(A,B) HC and PCA for PT, in vitro, in vivo and ex vivo samples for early and late passages (ep, lp). 6825 sites with standard deviation greater than 0.15 are presented. These sites are not differentially methylated between 827 and 923 (Mann-Whitney p-value more than 0.5). (C) Median methylation values for each sample based on selected 6825 sites.
Figure 4
Figure 4. Trancriptome data for high variation (std. dev. >1.3) 1901 probe sets.
(A) HC for matched PT-in vitro pairs for five GSC lines. (B) HC for PT and in vitro-in vivo-ex vivo triplicates for early and late passage 827 samples (C) Median expression values for all samples. (D) HC for PT and in vitro-in vivo-ex vivo triplicates for early and late passage 923 samples.
Figure 5
Figure 5. Fold changes (x-axis) and mean methylation differences (y-axis) between paired in vitro-PT pairs for both differentially expressed and differentially methylated genes.
Differentially expressed genes determined with paired t-test. Genes with false discovery rate less than 0.05 (Benjamini-Hochberg) and absolute fold change greater than three are used. Differentially methylated sites determined with paired non-parametric Quade test and sites with false discovery rate less than 0.05 (Benjamini-Hochberg) and absolute methylation difference greater than 0.3 are used.

References

    1. Chen J, McKay RM, Parada LF (2012) Malignant glioma: lessons from genomics, mouse models, and stem cells. Cell 149: 36–47. - PMC - PubMed
    1. Jones TS, Holland EC (2011) Animal models for glioma drug discovery. Expert Opinion on Drug Discovery 6: 1271–1283. - PubMed
    1. Bhat KP, Balasubramaniyan V, Vaillant B, Ezhilarasan R, Hummelink K, et al. (2013) Mesenchymal differentiation mediated by NF-κB promotes radiation resistance in glioblastoma. Cancer cell 24: 331–346. - PMC - PubMed
    1. Soda Y, Marumoto T, Friedmann-Morvinski D, Soda M, Liu F, et al. (2011) Transdifferentiation of glioblastoma cells into vascular endothelial cells. Proceedings of the National Academy of Sciences 108: 4274–4280. - PMC - PubMed
    1. Singh D, Chan JM, Zoppoli P, Niola F, Sullivan R, et al. (2012) Transforming fusions of FGFR and TACC genes in human glioblastoma. Science 337: 1231–1235. - PMC - PubMed