. 2014 Jun;15(6):580-587.
doi: 10.1038/ni.2868. Epub 2014 Apr 13.

Inflammation-induced repression of chromatin bound by the transcription factor Foxp3 in regulatory T cells

Affiliations

Inflammation-induced repression of chromatin bound by the transcription factor Foxp3 in regulatory T cells

Aaron Arvey et al. Nat Immunol. 2014 Jun.

Abstract

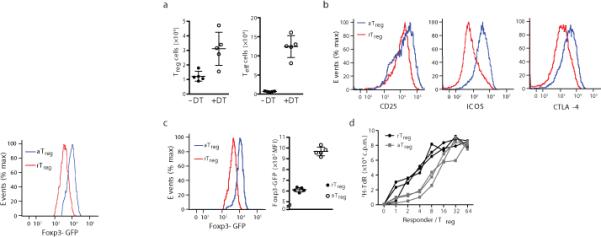
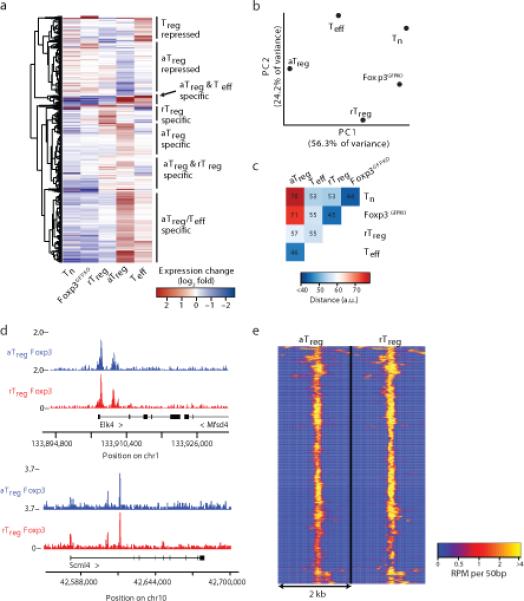
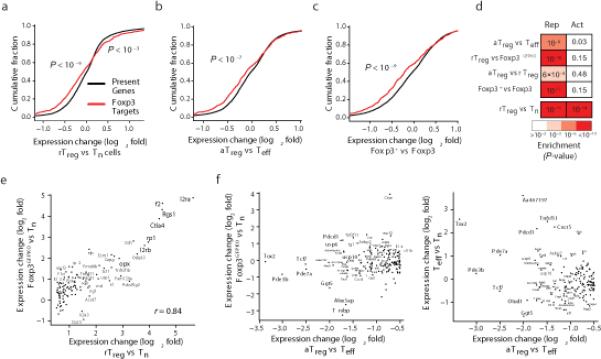
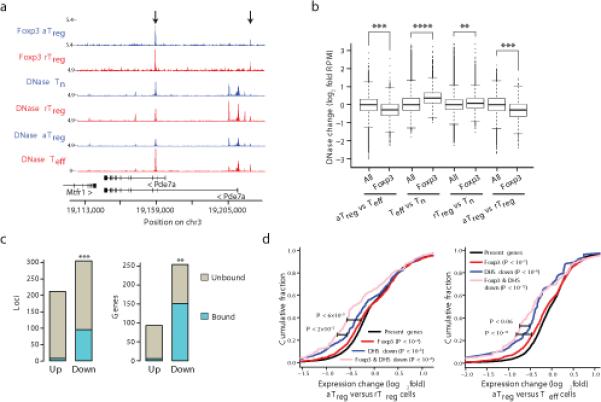
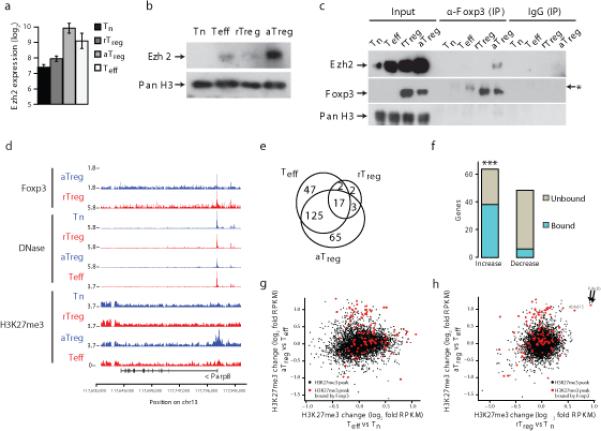
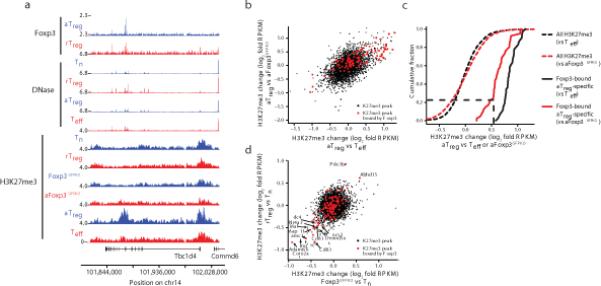
The transcription factor Foxp3 is indispensable for the ability of regulatory T cells (Treg cells) to suppress fatal inflammation. Here we characterized the role of Foxp3 in chromatin remodeling and the regulation of gene expression in actively suppressive Treg cells in an inflammatory setting. Although genome-wide occupancy of regulatory elements in DNA by Foxp3 was similar in resting Treg cells and those activated in vivo, Foxp3-bound enhancer elements in the DNA were poised for repression only in activated Treg cells. Following activation, Foxp3-bound sites showed diminished accessibility of chromatin and selective deposition of histone H3 trimethylated at Lys27 (H3K27me3), which was associated with recruitment of the histone methyltransferase Ezh2 and downregulation of the expression of nearby genes. Thus, Foxp3 poises its targets for repression by facilitating the formation of repressive chromatin in Treg cells upon their activation in response to inflammatory cues.


Figures

Figure 1
Figure 1
Isolation and functional characterization of in vivo activated Treg cells. (a) Expansion of Teff (CD44hiCD62Llo) and Foxp3+ Treg cell subsets in cells sorted from diphtheria toxin (DT) treated Foxp3DTR mice. Activated Treg (aTreg) and resting Treg (rTreg) cells were isolated from DT and untreated Foxp3DTR mice, respectively. (b) Flow cytometric analysis of CTLA-4, ICOS, and CD25 on aTreg cells. The results represent one of three independent experiments each with three or more mice per group. (c) Foxp3 expression is elevated in aTreg vs. rTreg cells. (d) aTreg cells are more suppressive than resting Treg cells. In vitro proliferation of responder CD4+ T cells in the presence of titrated amounts of sorted Treg cells in 72 h cultures was assessed by 3H-thymidine (3HTdR) labeling during the last 8 h. The data are shown as mean counts per minute (CPM) 3H-TdR incorporation in triplicate cultures. Cells were isolated using an Aria II FACS instrument from DT-treated and untreated Foxp3DTR mice (3 mice per group).
Figure 2
Figure 2
Characterization of in vivo activated Treg cell gene expression and Foxp3 chromatin localization. (a) Transcriptional profiling using Affymetrix Mouse Genome 430 2.0 arrays showed distinct gene expression clusters in aTreg, rTreg, Foxp3GFPKO (GFP+ CD4+ T cells from Foxp3GFPKO/WT mice), Teff, and Tn cells. Genes (rows) are significantly differentially expressed in aTreg cells compared to rTreg or Teff cells and hierarchically clustered based on Euclidean distance. Expression arrays were analyzed for DT treated Foxp3DTR mice (5 biological replicates), untreated Foxp3DTR mice (3 biological replicates), and Foxp3GFPKO/WT mice (3 biological replicates). (b) Principal component analysis of transcriptomes of aTreg, rTreg, Teff, Tn, and Foxp3GFPKO cells. The first and second principle components (PCs) are shown. (c) Pairwise Euclidean distance quantification of the similarity between gene expression profiles of indicated cell subsets shows similarity of activated cell types. (d) Foxp3 binds the Scml4 and Elk4 loci to a similar extent in aTreg and rTreg cells. The tracks show strand-extended read overlap in units of reads per million (RPM). (e) Genome-wide Foxp3 binding in Treg cells is similar in resting and activated states. The heatmap shows quantitative spatial binding patterns of Foxp3. The data represent an average of four Foxp3 ChIP-seq experiments for aTreg cells and two experiments for rTreg cells. Each row represents a separate binding site.
Figure 3
Figure 3
Foxp3 acts predominantly as a repressor. (a) Foxp3-bound genes are quantitatively differentially up- and downregulated in rTreg in comparison to Tn cells (p-values show one-tailed KS tests). (b, c) Foxp3-bound genes are significantly and quantitatively downregulated in aTreg vs. Teff cells (b) and Foxp3+ vs. Foxp3Δ cells (c). To generate Foxp3Δ cells, sorted Foxp3+ CD4+ T cells from Foxp3fl mice were activated in vitro and transduced with a Cre recombinase and reporter expressing retroviral vector; transduced cells were sorted using an Aria II FACS instrument. (d) Foxp3-bound genes are exclusively enriched for downregulation across all cell-type comparisons and perturbations except for the rTreg vs. Tn comparison. The p-values shown reflect statistical significance of overlap between Foxp3-bound genes and genes up- or downregulated in the indicated cell types (hypergeometric test; see also Figure S3C). (e) Foxp3-bound genes upregulated in rTreg vs. Tn cells (x-axis) are also upregulated in a Foxp3-independent manner in Foxp3GFPKO cells (y-axis). Only significantly differentially expressed Foxp3 targets are shown (Benjamini-Hochberg corrected, q < 0.05). (f) Foxp3-bound genes that are downregulated in aTreg vs Teff cells (x-axis) require Foxp3 for their repression as they are not repressed in Foxp3GFPKO or Teff cells (y-axes). Only significantly differentially expressed Foxp3-bound genes are shown (Benjamini-Hochberg corrected, q < 0.05).
Figure 4
Figure 4
Foxp3 binds regulatory loci that are poised for repression in inflammatory environments. (a) DNase-seq and Foxp3 ChIP-seq reads mapped to Pde7a show decreased DNase-accessibility in aTreg cells. The highest quality dataset of two independent DNase-seq replicates is shown. (b) Regulatory loci bound by Foxp3 exhibit decreased accessibility in aTreg vs. Teff or rTreg cells, increased accessibility in Teff vs. Tn cells, and moderately increased accessibility in rTreg vs. Tn cells (p-values shown were derived using a standard t-test; p-values less than 10−20, 10−100, 10−200, are shown by **, ***, ****, respectively). DNase hypersensitive sites (DHSs) were identified as Foxp3-bound if 150bp DHS peaks overlapped with 150bp Foxp3 peaks. (c) Foxp3 binds a highly significant portion (in blue) of regulatory loci (left) and genes (right) with specifically decreased DNase accessibility in aTreg cells (y-axis). Hypergeometric overlap test p-value and odds ratio (OR) are shown; p-values less than 10−40, 10−70, are shown by **, ***, respectively). (d) Genes near Foxp3-bound loci with aTreg-specific decreased chromatin (DNase) accessibility (pink) are more downregulated in comparison to all Foxp3-bound genes (red) or all genes with aTreg-specific decrease in DNase accessibility (blue). The downregulation was observed in aTreg in comparison to both rTreg (left) and Teff (right) cell populations. KS test p-values in parenthesis are relative to all present genes (black) and p-values next to bars show significance of difference between respective gene sets.
Figure 5
Figure 5
Foxp3 interacts with Ezh2 and binds loci enriched for H3K27me3 marks in aTreg cells. (a) Increased Ezh2 mRNA in aTreg cells, as measured by gene expression microarray analysis. Error bars indicate standard deviation. Array analysis was performed using cells isolated from DT treated Foxp3DTR mice (n=5), untreated Foxp3DTR mice (n=3), and Foxp3GFPKO/WT mice (n=3). (b) Ezh2 protein is upregulated in aTreg cells, as assessed by Ezh2 immunoblot analysis of lysates from indicated cell subsets. Histone H3 served as a loading control. Results are representative of two experiments. (c) Foxp3 physically interacts with Ezh2 in activated Treg cells. Foxp3 complexes were immunoprecipitated with Foxp3 antibody and probed with Ezh2 or Foxp3 specific antibodies. Lysate from aTreg cells was diluted to adjust for an increase in Foxp3 and Ezh2 protein expression in aTreg cells (as shown in Figs. 1c,5b), resulting in lower amounts of Foxp3 protein loaded in the “aTreg” lane compared to the “rTreg” lane. Histone H3 served as a loading control. A non-specific band is marked by a “*”. Results are representative of n=2 experiments. (d) The Parp8 gene locus is bound by Foxp3 and has decreased DNase-accessibility and increased H3K27me3 in aTreg cells. H3K27me3 ChIP-seq data are representative of two independent experiments. (e) The Venn diagram shows number of genes with increases in H3K27me3 relative to Tn cells. (f) Genes with aTreg-specific increases in H3K27me3-bound chromatin are highly enriched for Foxp3 binding, in contrast to genes with aTreg-specific decreases in H3K27me3-bound chromatin (hypergeometric test p-value shown, ** indicates p < 10−24). (g) aTreg cell-specific H3K27me3 sites (y-axis) are distinct from activation induced H3K27me3 sites in Teff cells (x-axis). (h). Pde3b is the only Foxp3-bound gene enriched for H3K27me3 marks in both aTreg (y-axis) and rTreg cells (x-axis). All other Foxp3-bound loci exhibit increased H3K27 marks only in aTreg cells.
Figure 6
Figure 6
Formation of H3K27me3 marked chromatin at Foxp3-bound loci in activated Treg cells is dependent on Foxp3 protein expression. (a) The Tbc1d4 gene exemplifies the requirement for Foxp3 protein expression for H3K27 tri-methylation at Foxp3-bound sites in aTreg cells. H3K27me3 ChIP-seq data are representative of two independent replicates. (b) Foxp3 is required to increase H3K27me3 in aTreg cells in comparison to activated Foxp3GFPKO (aFoxp3GFPKO) cells. Increases in H3K27me3 in aTreg cells were similar when compared to either Teff or aFoxp3GFPKO cells. (c) Quantification of H3K27me3 at Foxp3-bound and -unbound loci in aTreg cells compared to Teff or activated Foxp3GFPKO cells. (d) Loss of H3K27me3 is independent of Foxp3. Comparison of H3K27me3 changes in rTreg vs. resting Foxp3GFPKO (x-axis) or Tn (y-axis) cells shows that decreases in H3K27me3 occur prior to expression of Foxp3 protein. RPKM: reads per kilobase per million mapped reads.

References

    1. Ohkura N, Kitagawa Y, Sakaguchi S. Development and maintenance of regulatory T cells. Immunity. 2013;38:414–423. - PubMed
    1. Josefowicz S, Lu L-F, Rudensky AY. Regulatory T cells: mechanisms of differentiation and function. Annu. Rev. Immunol. 2012;30:531–564. - PMC - PubMed
    1. Gavin MA, et al. Foxp3-dependent programme of regulatory T-cell differentiation. Nature. 2007;445:771–775. - PubMed
    1. Lin W, et al. Regulatory T cell development in the absence of functional Foxp3. Nat. Immunol. 2007;8:359–368. - PubMed
    1. Williams LM, Rudensky AY. Maintenance of the Foxp3-dependent developmental program in mature regulatory T cells requires continued expression of Foxp3. Nat. Immunol. 2007;8:277–284. - PubMed

Publication types

MeSH terms

Associated data