. 2014 Apr 11;9(4):e94484.
doi: 10.1371/journal.pone.0094484. eCollection 2014.

Multiple exposure and effects assessment of heavy metals in the population near mining area in South China

Affiliations

Multiple exposure and effects assessment of heavy metals in the population near mining area in South China

Ping Zhuang et al. PLoS One. .

Abstract

The objective of this study was to investigate the levels of Cd, Pb, Cu and Zn in the environment and several important food sources grown and consumed in the vicinity of Dabaoshan mine in Southern China, and evaluate potential health risks among local residents. The Cd, Pb, Cu and Zn concentrations of arable soils and well water near the mines exceeded the quality standard values. The concentrations of Cd and Pb in some food crops (rice grain, vegetable and soybean) samples were significantly higher than the maximum permissible level. The Cd and Pb concentrations in half of the chicken and fish meat samples were higher than the national standard. The residents living near Dabaoshan mine had higher Cd and Pb levels in hair than those of a non-exposed population. The intake of rice was identified as a major contributor to the estimated daily intake of these metals by the residents. The hazard index values for adults and children were 10.25 and 11.11, respectively, with most of the estimated risks coming from the intake of home-grown rice and vegetables. This study highlights the importance of multiple pathways in studying health risk assessment of heavy metal exposure in China.


Conflict of interest statement

Competing Interests: The authors have declared that no competing interests exist.

Figures

Figure 1
Figure 1. The location of sampling sites in the vicinity of Dabaoshan mine in Guangdong province in South China.
The six sampled villages are Shaxi, Dongshan, Fandong, Liangqiao, Shangba and Xinjiang.
Figure 2
Figure 2. Comparison of concentrations (mg/kg, mean ± SD) of Cd, Pb, Cu and Zn and their respective Chinese national quality value (dotted line) in paddy soil, rice grain and chicken muscle samples collected at different localities in the vicinity of Dabaoshan mine.
The number of samples is 9 for respective paddy soil, 8–10 for rice grain, 24 for each group chicken. For soil and rice samples, they were collected from six specific locations, including Shixi (SX), Dongshan (DS), Fandong (FD), Liangqiao (LQ), Shangba (SB) and Xinjiang (XJ). The chicken was fed with rice grain collected from Fandong village.
Figure 3
Figure 3. Comparison of concentrations (mg/kg, mean ± SD) of Cd, Pb, Cu and Zn and their respective Chinese national quality value (dotted line) in garden soil, leafy vegetables, non-leafy vegetables and bean samples from different locations.
The number of samples is 9 for respective garden soil, 3–5 for each vegetable, 15 for respective soybean. For soil and vegetable samples, they were collected from six specific locations, including Shixi (SX), Dongshan (DS), Fandong (FD), Liangqiao (LQ), Shangba (SB) and Xinjiang (XJ). The bean samples were collected from DS and FD villages.
Figure 4
Figure 4. Bioaccumulation factor (BAF), a ratio of heavy metals concentration in the edible part of rice, leafy vegetables, non-leafy vegetables and soybean to that in the corresponding soil.
Figure 5
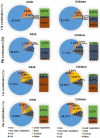
Figure 5. Relative contribution profile of daily human intake.
Relative contribution was derived by dividing the daily intake estimate from a given source by the total daily intake estimate from all of the sources under investigation.
Figure 6
Figure 6. Box-plot diagram of four elements in hair samples from two villages (Dongshan, DS, Fandong, FD) in the vicinity of Dabaoshan mine and the control area (non-exposed site).
Y-axis is presented in logarithmic scale. The central mark on each box is the median with the edges of the 25th and 75th percentiles.

References

    1. Rybicka EH (1996) Impact of mining and metallurgical industries on the environment in Poland. Appl Geochem 11: 3–9.
    1. Dudka S, Adriano DC (1997) Environmental impacts of metal ore mining and processing: a review. J Environ Qual 26: 590–602.
    1. Benin AL, Sargent JD, Kalton M, Roda S (1999) High concentrations of heavy metals in neighborhoods near ore smelters in northern Mexico. Environ Health Perspect 107: 279–184. - PMC - PubMed
    1. Plumlee GS, Morman SA (2011) Mine wastes and human health. Element 7: 399–404.
    1. Shu WS, Zhang ZQ, Lan CY (2000) Strategies for restoration of mining wastelands in China. Ecol Sci 19: 24–29.

Publication types

LinkOut - more resources