Review
. 2014 Jun;42(10):6091-105.
doi: 10.1093/nar/gku241. Epub 2014 Apr 11.

Classification and evolution of type II CRISPR-Cas systems

Affiliations
Review

Classification and evolution of type II CRISPR-Cas systems

Krzysztof Chylinski et al. Nucleic Acids Res. 2014 Jun.

Abstract

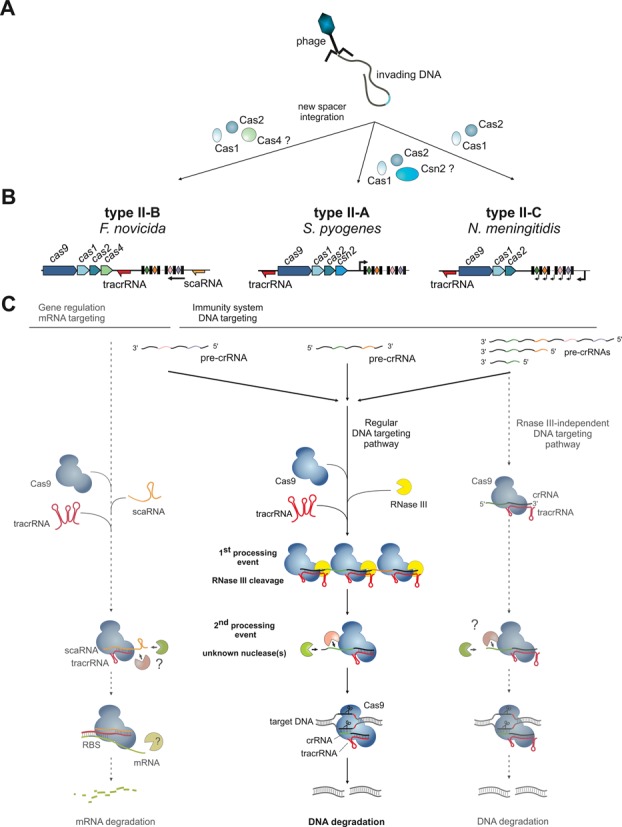
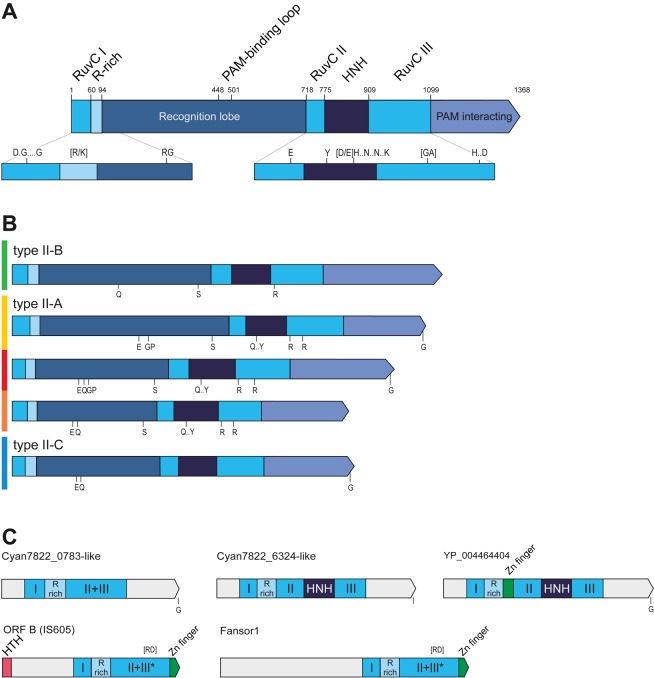
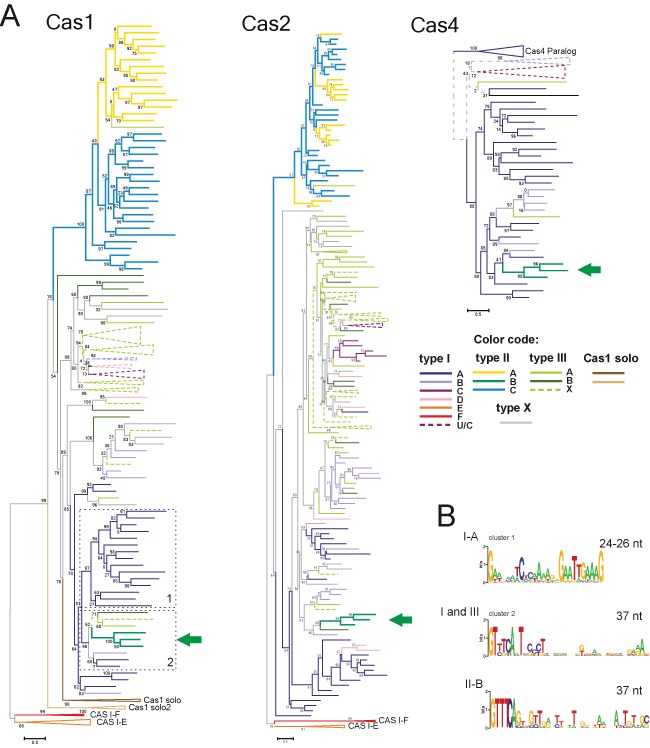
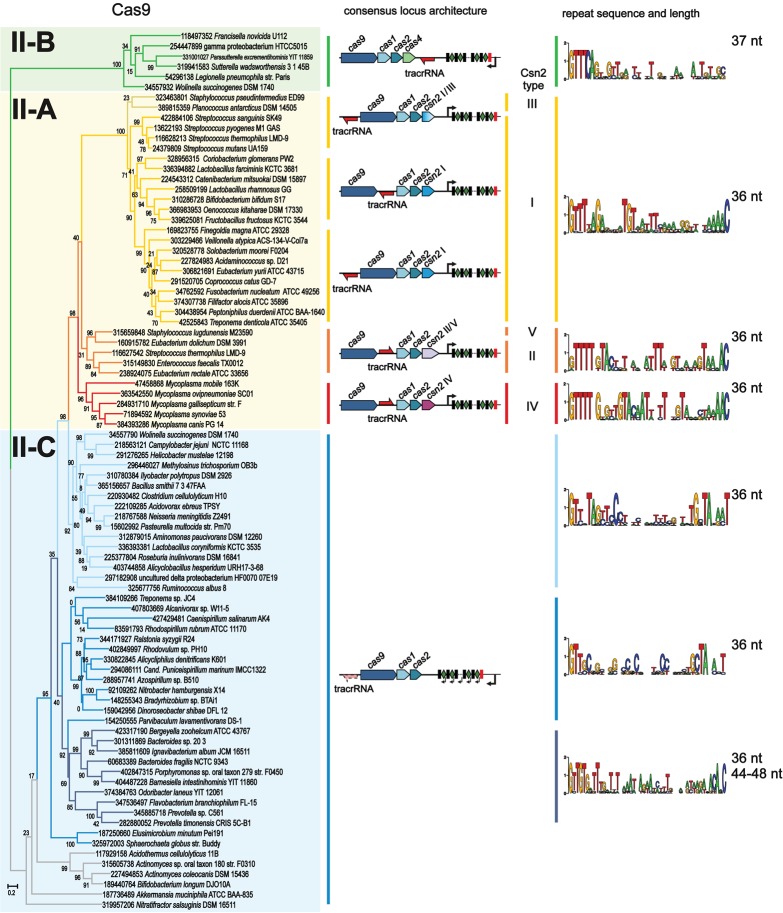
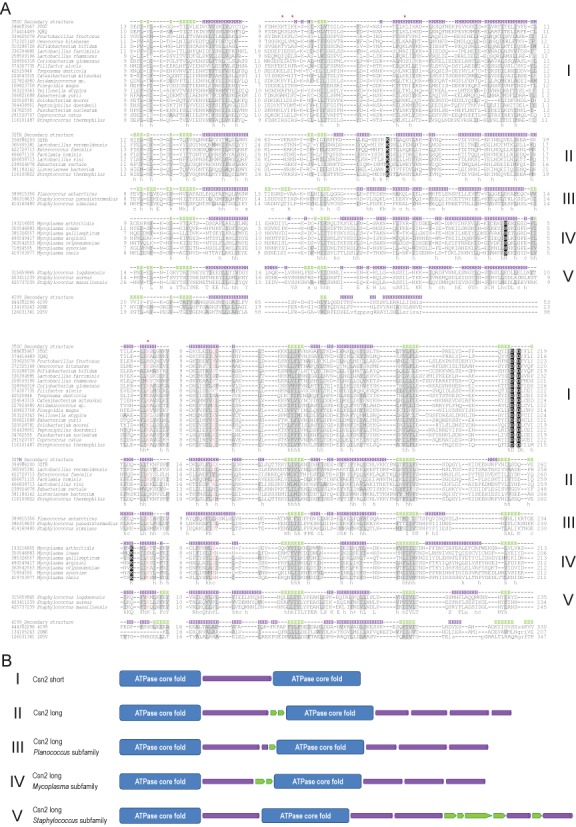
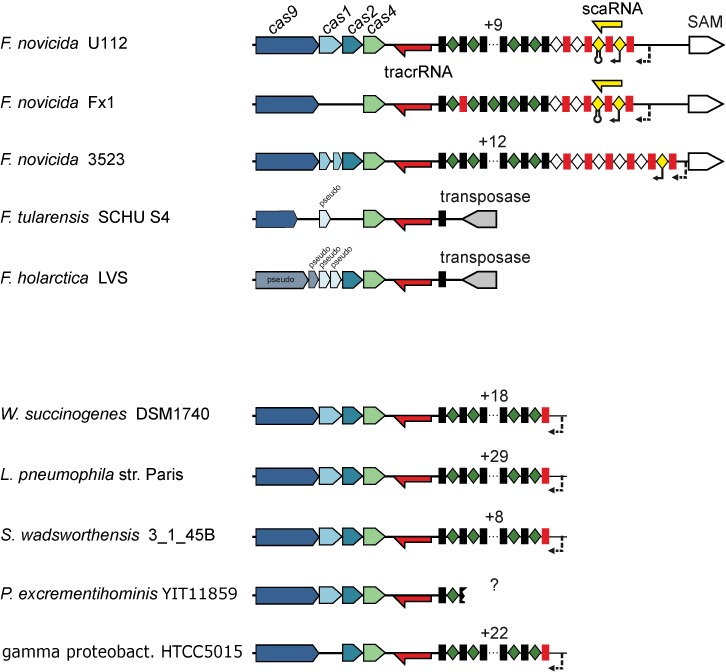
The CRISPR-Cas systems of archaeal and bacterial adaptive immunity are classified into three types that differ by the repertoires of CRISPR-associated (cas) genes, the organization of cas operons and the structure of repeats in the CRISPR arrays. The simplest among the CRISPR-Cas systems is type II in which the endonuclease activities required for the interference with foreign deoxyribonucleic acid (DNA) are concentrated in a single multidomain protein, Cas9, and are guided by a co-processed dual-tracrRNA:crRNA molecule. This compact enzymatic machinery and readily programmable site-specific DNA targeting make type II systems top candidates for a new generation of powerful tools for genomic engineering. Here we report an updated census of CRISPR-Cas systems in bacterial and archaeal genomes. Type II systems are the rarest, missing in archaea, and represented in ∼ 5% of bacterial genomes, with an over-representation among pathogens and commensals. Phylogenomic analysis suggests that at least three cas genes, cas1, cas2 and cas4, and the CRISPR repeats of the type II-B system were acquired via recombination with a type I CRISPR-Cas locus. Distant homologs of Cas9 were identified among proteins encoded by diverse transposons, suggesting that type II CRISPR-Cas evolved via recombination of mobile nuclease genes with type I loci.


Figures

Figure 1.
Figure 1.
General scheme of the mechanism of type II CRISPR-Cas systems. (A) Proteins responsible for new spacer acquisition are shown for different type II subtypes. (B) Typical type II CRISPR-Cas locus architecture for three major subtypes shown together with a representative strain locus scheme. Red and orange arrows: tracrRNA and scaRNA with transcription direction indicated, respectively; black rectangles: repeats; diamonds: spacers; red rectangles: degenerated repeats; black arrows: pre-crRNA promoters. In type II-B, the localization of the pre-crRNA promoter in relation to the scaRNA is not known (see the paragraph ‘Role of type II CRISPR-Cas in virulence and origin of scaRNA’); the arrow represents only the direction of pre-crRNA transcription. Note the differences in the loci architecture with respect to cas gene composition, tracrRNA and repeat–spacer array transcription orientation and tracrRNA position. (C) Mechanisms of type II CRISPR-Cas systems. The classical DNA targeting pathway, common to all type II CRISPR-Cas systems (middle), involves co-processing of Cas9-stabilized tracrRNA:pre-crRNA duplexes by RNase III upon binding of tracrRNA anti-repeat to the pre-crRNA repeat, followed by trimming of crRNA by a yet unknown mechanism. The mature tracrRNA:crRNA guides the Cas9 endonuclease to introduce site-specifically dsDNA breaks in the invading DNA. The mechanism shown here for the type II-A of S. pyogenes was also shown for the type II-A of S. thermophilus (22,51). The alternative DNA targeting mechanism (right), described in type II-C of N. meningitidis (38), does not involve RNase III co-processing due to transcription of a short crRNA directly from an upstream repeat-encoded promoter. In type II-B of F. novicida (39), the system evolved to possibly target endogenous mRNA expression (left). We hypothesize that similar to tracrRNA:crRNA-Cas9, the tracrRNA:scaRNA-Cas9 complex is first formed. The scaRNA in the complex would undergo trimming by unknown nucleases [the size of most abundant scaRNA forms is shorter than predicted (39) according to RNAseq data (not shown)]. The tracrRNA:scaRNA-Cas9 further recognizes mRNA upon binding of the tracrRNA 3′ region to the target mRNA leading to its degradation by an unknown mechanism.
Figure 2.
Figure 2.
Schematic representation of Cas9 domain organization, motifs and relationships with distant homologs. (A) A general view of the domain architecture of Cas9. (B) Comparison of the domain organizations and conserved sequences motifs between the major groups of Cas9 proteins. (C) Domain architectures of distant homologs of Cas9. Homologous regions are shown by the same color. Compare with Supplementary Figure S8. The S. pyogenes Cas9 schematic representation with domains and domain boundaries according to the Cas9 structures (76,77) is shown in (A). See Supplementary Figure S4. Distinct sequence motifs are denoted by the corresponding conserved amino acid residues. The residues indicated in (A) are conserved in all five Cas9 groups and in (B), within the given subtype. Compare with Supplementary Figure S4. The size of a domain or a distinct region is roughly proportional to the length and the motifs are shown in accordance with their approximate position within a respective protein. The scheme was derived from the multiple alignments of each group. The color code to the left of the protein schematics in (B) corresponds to the major branches of the Cas9 phylogenetic tree in Figure 4. HTH: helix turn helix DNA-binding domain; R-rich: arginine-rich region; HNH: nuclease of the corresponding family.
Figure 3.
Figure 3.
Origin of type II-B CRISPR-Cas system. (A) The PSI-BLAST program was used to retrieve Cas1 protein sequences from 2262 complete genomes in the Refseq database. The BLASTCLUST program (length coverage cutoff 0.8; score density threshold 1.0) was used to select 205 representative sequences. The multiple alignment was built using the MUSCLE program (see Supplementary Materials and Methods for details). The FastTree program ([Jones-Taylor-Thornton (JTT) evolutionary model, discrete gamma model for site rates with 20 rate categories; see Supplementary Materials and Methods for details] was used for the tree reconstruction. The Cas2 and Cas4 phylogenetic trees were reconstructed using the FastTree program as indicated for the Cas1 tree above. The sequences of these families were chosen from the same genomic neighborhoods as the selected Cas1 representatives (a few incomplete sequences from both protein families were either omitted or replaced by closely related sequences from other species). Type II-B branches are indicated by the green arrow. The branches are colored according to the assignment of cas1 genes to CRISPR-Cas subtypes based on the analysis of 10 upstream and 10 downstream genes. X denotes systems of unknown type or those that are predicted to be derivatives of the respective system (when colored). The trees are shown only schematically, the complete trees are available in Supplementary Figure S2. (B) Logoplots of CRISPR repeats for the genomes that belong to several branches that are neighbors of the type II-B branch on the Cas1 phylogenetic tree. Clusters 1 and 2 are indicated by dashed lines. The type II-B (cluster 2) logoplot is shown separately. See details in Supplementary Figure S3.
Figure 4.
Figure 4.
Cas9 phylogeny as a basis for type II system classification. The multiple alignment for the representative set of Cas9 sequences was constructed using the MUSCLE program followed by manual adjustment based on the results of pairwise alignments by PSI-BLAST, HHPRED and secondary structure predictions (see Supplementary Materials and Methods for details).
Figure 5.
Figure 5.
Multiple alignment of Csn2 subfamilies and comparison of their specific structural elements. (A) The multiple sequence alignment was constructed using the MUSCLE program for each Csn2 subfamily, separately. The alignments were then superimposed on the basis of conserved regions identified by HHPRED with some manual adjustment based on secondary structure predictions (see Supplementary Materials and Methods for details). The alignment with several ATPase sequences is based on Vector Alignment Search Tool (VAST) structural alignments with the structure of Csn2 of S. thermophilus (3ZTH) (17) used as a query (see Supplementary Materials and Methods for details). . The sequences are denoted by their GI numbers and species names. Secondary structure predictions and the secondary structure elements mapped to the respective crystal structures of the Csn2 long and short subfamilies are shown above the alignment for each Csn2 family. The positions of the first and last residues of the aligned region in the corresponding protein are indicated for each sequence. The numbers within the alignment represent poorly conserved inserts that are not shown. Secondary structure prediction is shown as follows: H indicates α-helix and E indicates extended conformation (β-strand). The positions strongly conserved in three families with a larger number of representatives are shown by reverse shading. The coloring is based on the 70% consensus built for a larger alignment (Supplementary Figure S7). Specific 90% consensus is also shown underneath the alignment for each family: ‘h’ indicates hydrophobic residues (WFYMLIVA), ‘c’ indicates charged residues (EDKRH) and ‘s’ indicates small residues (AGS). (B) Schematic representation of structures (actual and predicted) of five distinct Csn2 subfamilies. Cylindrical shape represents α-helix and arrow β-strand.
Figure 6.
Figure 6.
A schematic representation of the scaRNA-tracrRNA locus in Francisella strains. The type II-B CRISPR-Cas locus architecture of representative species (see Figure 4) and diverse Francisella species is shown. Red and yellow arrows: tracrRNA and scaRNA with indicated confirmed (22) or predicted transcription direction, accordingly; black rectangles and green diamonds: repeat–spacer arrays; red rectangles: degenerated repeats; white diamonds: putative spacers of degenerated arrays. Degenerated array spacers with the scaRNA promoter and transcriptional terminator are shown in yellow. Putative promoters of repeat–spacer arrays are shown with dotted arrows. The scaRNA-encoding spacer–repeat–spacer unit was found only in two of the analyzed strains and is incomplete in F. novicida 3523, lacking transcriptional terminator-encoding spacer. Note also the degenerate repeats that are commonly found at the 5′-end of the repeat–spacer array. See Supplementary Figure S12.

References

    1. Makarova K.S., Wolf Y.I., Koonin E.V. Comparative genomics of defense systems in archaea and bacteria. Nucleic Acids Res. 2013;41:4360–4377. - PMC - PubMed
    1. Barrangou R., Horvath P. CRISPR: new horizons in phage resistance and strain identification. Annu. Rev. Food Sci. Technol. 2012;3:143–162. - PubMed
    1. Wiedenheft B., Sternberg S.H., Doudna J.A. RNA-guided genetic silencing systems in bacteria and archaea. Nature. 2012;482:331–338. - PubMed
    1. van der Oost J., Jore M.M., Westra E.R., Lundgren M., Brouns S.J. CRISPR-based adaptive and heritable immunity in prokaryotes. Trends Biochem. Sci. 2009;34:401–407. - PubMed
    1. Makarova K.S., Haft D.H., Barrangou R., Brouns S.J., Charpentier E., Horvath P., Moineau S., Mojica F.J., Wolf Y.I., Yakunin A.F., et al. Evolution and classification of the CRISPR-Cas systems. Nat. Rev. Microbiol. 2011;9:467–477. - PMC - PubMed

Publication types

MeSH terms