

Dietary pattern trajectories during 15 years of follow-up and HbA1c, insulin resistance and diabetes prevalence among Chinese adults
- PMID: 24729424
- PMCID: PMC4082755
- DOI: 10.1136/jech-2013-203560
Dietary pattern trajectories during 15 years of follow-up and HbA1c, insulin resistance and diabetes prevalence among Chinese adults
Abstract
Background: Most research on dietary patterns and health outcomes does not include longitudinal exposure data. We used an innovative technique to capture dietary pattern trajectories and their association with haemoglobin A1c (HbA1c), homeostasis model of insulin resistance (HOMA-IR) and prevalence of newly diagnosed diabetes.
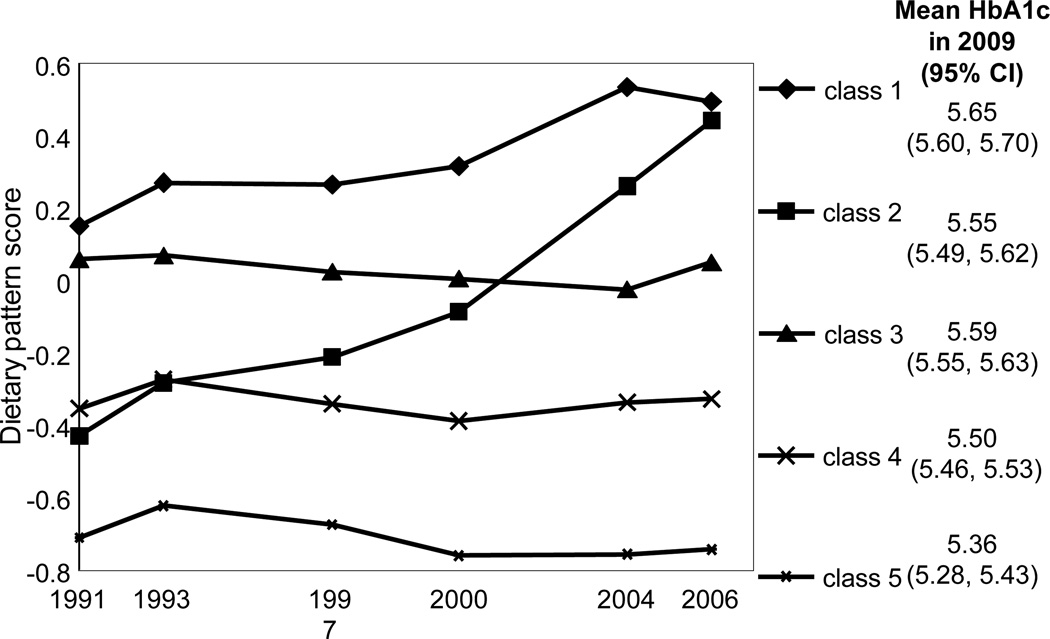
Methods: We included 4096 adults with 3-6 waves of diet data (1991-2006) and biomarkers measured in 2009 from the China Health and Nutrition Survey. Diet was assessed with three 24-h recalls and a household food inventory. We used a dietary pattern previously identified with reduced rank regression that positively predicted diabetes in 2006 (high in wheat products and soy milk and low in rice, legumes, poultry, eggs and fish). We estimated a score for this dietary pattern for each subject at each wave. Using latent class trajectory analysis, we grouped subjects with similar dietary pattern score trajectories over time into five classes.
Results: Three trajectory classes were stable over time, and in two classes the diet became unhealthier over time (upward trend in dietary pattern score). Among two classes with similar scores in 2006, the one with the lower (healthier) initial score had an HbA1c 1.64% lower (-1.64 (95% CI -3.17 to -0.11)) and non-significantly a HOMA-IR 6.47% lower (-6.47 (-17.37 to 4.42)) and lower odds of diabetes (0.86 (0.44 to 1.67)).
Conclusions: Our findings suggest that dietary pattern trajectories with healthier scores longitudinally had a lower HbA1c compared with those with unhealthier scores, even when the trajectories had similar scores in the end point.
Keywords: DIABETES; DIET; Epidemiological methods; LONGITUDINAL STUDIES.
Published by the BMJ Publishing Group Limited. For permission to use (where not already granted under a licence) please go to http://group.bmj.com/group/rights-licensing/permissions.
Figures
References
-
- Pan X-R, Yang W-Y, Li G-W, Liu J. Prevalence of diabetes and its risk factors in China, 1994. Diabetes care. 1997;20(11):1664–1669. - PubMed
-
- Xu Y, Wang L, He J, et al. Prevalence and control of diabetes in Chinese adults. JAMA. 2013 Sep 4;310(9):948–959. - PubMed
-
- Moeller SM, Reedy J, Millen AE, et al. Dietary patterns: challenges and opportunities in dietary patterns research an Experimental Biology workshop, April 1, 2006. Journal of the American Dietetic Association. 2007 Jul;107(7):1233–1239. - PubMed
-
- Hoffmann K, Schulze M, Boeing H, Altenburg H. Dietary patterns: report of an international workshop. Public health nutrition. 2002;5(1):89–90. - PubMed
-
- Hu FB. Dietary pattern analysis: a new direction in nutritional epidemiology. Current opinion in lipidology. 2002 Feb;13(1):3–9. - PubMed
Publication types
MeSH terms
Substances
Grants and funding
LinkOut - more resources
Full Text Sources
Other Literature Sources
Medical