. 2014 Aug;3(4):1041-51.
doi: 10.1002/cam4.251. Epub 2014 Apr 12.

Intestinal tumor suppression in ApcMin/+ mice by prostaglandin D2 receptor PTGDR

Affiliations

Intestinal tumor suppression in ApcMin/+ mice by prostaglandin D2 receptor PTGDR

Brigette L Tippin et al. Cancer Med. 2014 Aug.

Abstract

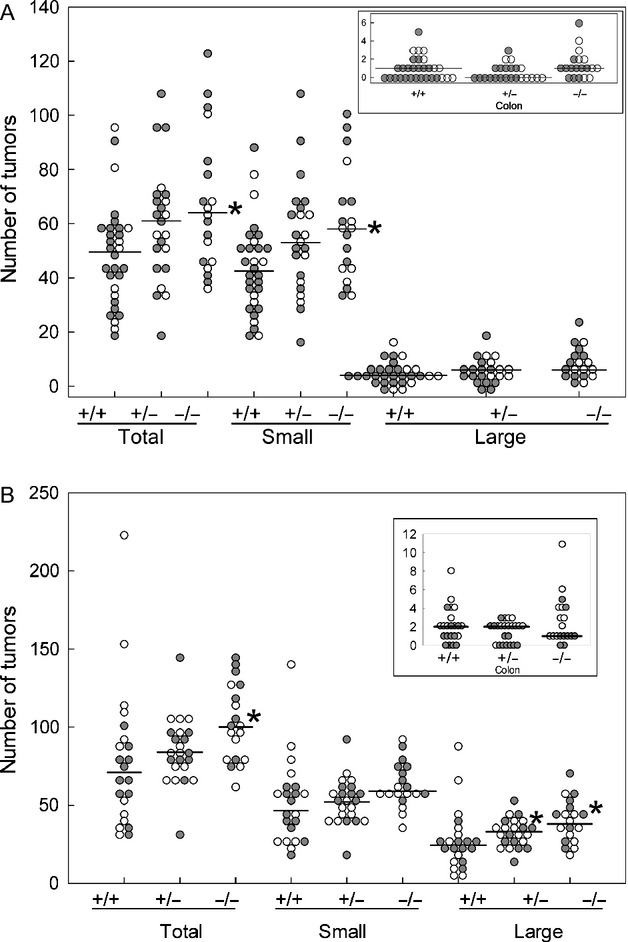
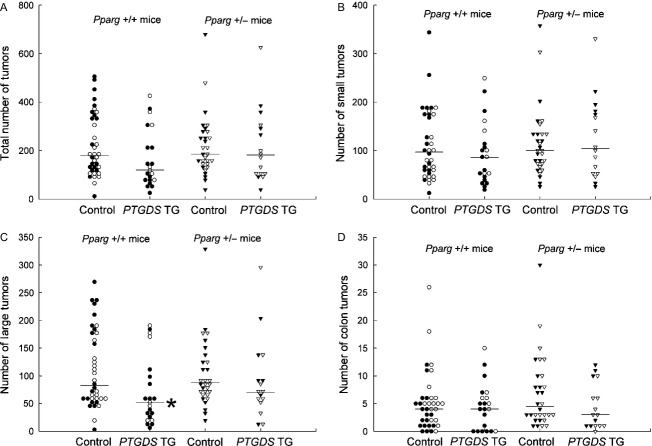
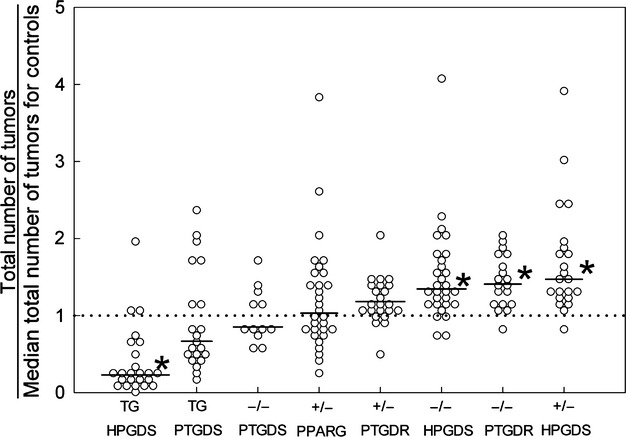
Our earlier work showed that knockout of hematopoietic prostaglandin D synthase (HPGDS, an enzyme that produces prostaglandin D2) caused more adenomas in Apc(Min/+) mice. Conversely, highly expressed transgenic HPGDS allowed fewer tumors. Prostaglandin D2 (PGD2) binds to the prostaglandin D2 receptor known as PTGDR (or DP1). PGD2 metabolites bind to peroxisome proliferator-activated receptor γ (PPARG). We hypothesized that Ptgdr or Pparg knockouts may raise numbers of tumors, if these receptors take part in tumor suppression by PGD2. To assess, we produced Apc(Min/+) mice with and without Ptgdr knockouts (147 mice). In separate experiments, we produced Apc(Min/+) mice expressing transgenic lipocalin-type prostaglandin D synthase (PTGDS), with and without heterozygous Pparg knockouts (104 mice). Homozygous Ptgdr knockouts raised total numbers of tumors by 30-40% at 6 and 14 weeks. Colon tumors were not affected. Heterozygous Pparg knockouts alone did not affect tumor numbers in Apc(Min/+) mice. As mentioned above, our Pparg knockout assessment also included mice with highly expressed PTGDS transgenes. Apc(Min/+) mice with transgenic PTGDS had fewer large adenomas (63% of control) and lower levels of v-myc avian myelocytomatosis viral oncogene homolog (MYC) mRNA in the colon. Heterozygous Pparg knockouts appeared to blunt the tumor-suppressing effect of transgenic PTGDS. However, tumor suppression by PGD2 was more clearly mediated by receptor PTGDR in our experiments. The suppression mechanism did not appear to involve changes in microvessel density or slower proliferation of tumor cells. The data support a role for PGD2 signals acting through PTGDR in suppression of intestinal tumors.

Keywords: Adenomatous polyposis coli; PPAR gamma; gastrointestinal neoplasms; prostaglandin D2 receptor; prostaglandin D2 synthases.


Figures

Figure 1
Figure 1
(A–E) Swiss roll section (14 weeks). (A) The box outlines B. Scale bar, 5 mm. (B) The top, middle, and bottom boxes outline E, C, and D, respectively. Scale bar, 1 mm. (C) An early adenoma abutting against a larger adenoma. Scale bar, 200 μm. (D) An early adenoma expanding the villus base. Scale bar, 200 μm. (E) A large adenoma. Scale bar, 200 μm. (F–G) In situ hybridization for PTGDR (12 weeks). (F) Detection of PTGDR mRNA with antisense probes. PTGDR mRNA appears as blue deposits in stromal cells, in a pattern consistent with lymphocytes or monocytes, or both. (G) Sense probes showed no staining (negative control). Counterstained with neutral red. Scale bar, 100 μm. (H–O) Immunohistochemistry (14 weeks). (H–K) High production of human PTGDS and HPGDS in transgenic mice, shown by immunoperoxidase staining (with rabbit polyclonal anti-human PTGDS [H, I] or HPGDS [J, K] antibodies). Staining (brown) occurred in all cell types of the small bowel and colon (epithelium and stroma). Scale bars, 50 μm. (H) Small bowel villi from a wild-type mouse. Antibody labeling is mostly in the cytosol of some epithelial cells, with occasional stromal cell staining. (I) A small bowel villus from a PTGDS transgenic mouse. Antibody binding is heavy throughout the villus, with a cytoplasmic staining pattern. (J) Small bowel villi from a wild-type mouse. HPGDS staining is mainly within the stroma of villi, not epithelial cells. Earlier studies showed these cells to be macrophages and monocytes. (K) Small bowel villi from an HPGDS transgenic mouse, showing heavy antibody staining in all cells (as in I). (L, M) Staining for PCNA in intravillar tumors from ApcMin/+ mice, with and without HPGDS transgenes. There was no consistent difference in staining between mice with and without transgenic HPGDS. Scale bars, 100 μm. (L) An intravillar adenoma from an ApcMin/+ mouse. (M) An intravillar tumor from an HPGDS transgenic ApcMin/+ mouse. (N, O) Staining for microvessels with anti-CD31 antibodies in tumors from ApcMin/+ mice with and without HPGDS transgenes. There was no consistent difference in staining between mice with and without transgenic HPGDS. Scale bars, 100 μm. (N) A tumor from an ApcMin/+ mouse. (O) A tumor from an HPGDS transgenic ApcMin/+ mouse.
Figure 2
Figure 2
Tumors in ApcMin/+ mice, with and without Ptgdr knockouts (total, small, large, and colon). (A) Tumors at 6 weeks. (B) Tumors at 14 weeks. +/+, control ApcMin/+ mice. +/− and −/−, ApcMin/+ mice with heterozygous and homozygous Ptgdr knockouts, respectively. Filled symbols: females. Open symbols: males. Horizontal bars: medians. *< 0.025. See Tables S1 and S2 for details.
Figure 3
Figure 3
Tumors in ApcMin/+ mice with PTGDS transgenes, with and without heterozygous Pparg knockouts (all 14 weeks). Data are for total (A), small (B), large (C), and colon tumors (D). There were statistically significant reductions in numbers of large tumors (C) in PTGDS transgenic mice without Pparg knockouts. See Table S3 for details. Pparg +/+ indicates no Pparg knockout. Pparg +/− indicates heterozygous Pparg knockout. Symbols are as in Figure2. *< 0.025.
Figure 4
Figure 4
Tumors in ApcMin/+ mice with various mutations that affect PGD2 production or binding (all at 14 weeks). Total numbers of tumors scored for each mouse were divided by the median total number of tumors scored among that mouse's controls. HPGDS transgenes are the most tumor-suppressive mutations, whereas homozygous Ptgdr knockouts and homozygous and heterozygous Hpgds knockouts are the most tumorigenic. The dotted line represents median control values (defined as 1.0). TG, transgenic; +/−, heterozygous knockouts; −/−, homozygous knockouts. Horizontal bars, median values: HPGDS TG, 0.23; PTGDS TG, 0.67; Ptgds −/−, 0.85; Pparg +/−, 1.03; Ptgdr +/−, 1.18; Hpgds −/−, 1.34; Ptgdr −/−, 1.40; Hpgds +/−, 1.47. *< 0.05.

References

    1. Nakanishi M, Montrose DC, Clark P, Nambiar PR, Belinsky GS, Claffey KP, et al. Genetic deletion of mPGES-1 suppresses intestinal tumorigenesis. Cancer Res. 2008;68:3251–3259. - PubMed
    1. Wang D. Dubois RN. Eicosanoids and cancer. Nat. Rev. Cancer. 2010;10:181–193. - PMC - PubMed
    1. Kim SH, Park YY, Kim SW, Lee JS, Wang D. DuBois RN. ANGPTL4 induction by prostaglandin E2 under hypoxic conditions promotes colorectal cancer progression. Cancer Res. 2011;71:7010–7020. - PMC - PubMed
    1. Xia D, Wang D, Kim SH, Katoh H. DuBois RN. Prostaglandin E2 promotes intestinal tumor growth via DNA methylation. Nat. Med. 2012;18:224–226. - PMC - PubMed
    1. Park JM, Kanaoka Y, Eguchi N, Aritake K, Grujic S, Materi AM, et al. Hematopoietic prostaglandin D synthase suppresses intestinal adenomas in ApcMin/+ mice. Cancer Res. 2007;67:881–889. - PubMed

Publication types

MeSH terms