. 2014 Feb 1;161(2):B3160-B3166.
doi: 10.1149/2.022402jes.

Improving Reproducibility of Lab-on-a-Chip Sensor with Bismuth Working Electrode for Determining Zn in Serum by Anodic Stripping Voltammetry

Affiliations

Improving Reproducibility of Lab-on-a-Chip Sensor with Bismuth Working Electrode for Determining Zn in Serum by Anodic Stripping Voltammetry

Xing Pei et al. J Electrochem Soc. .

Abstract

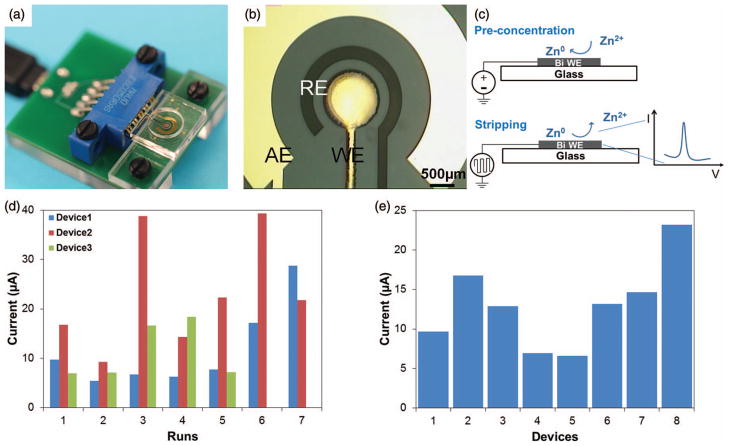
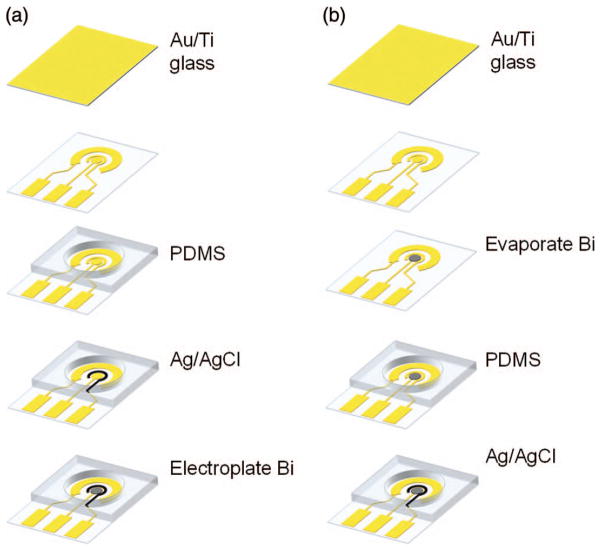
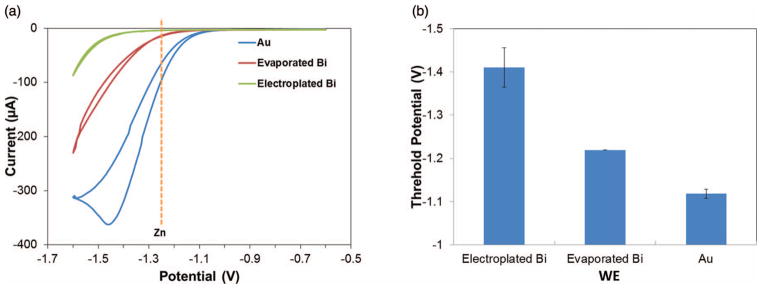
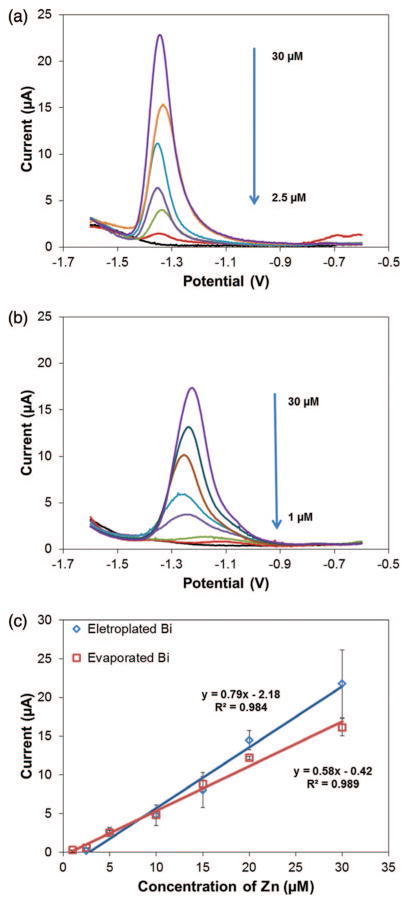
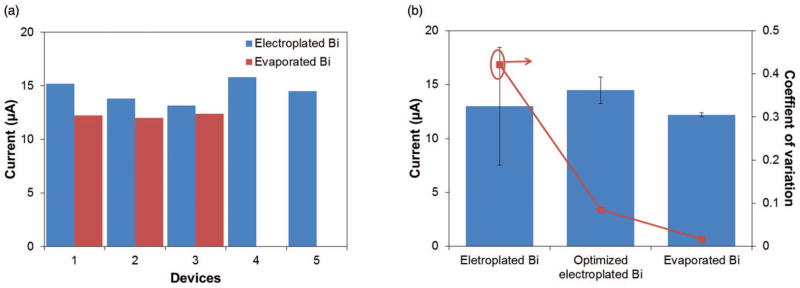
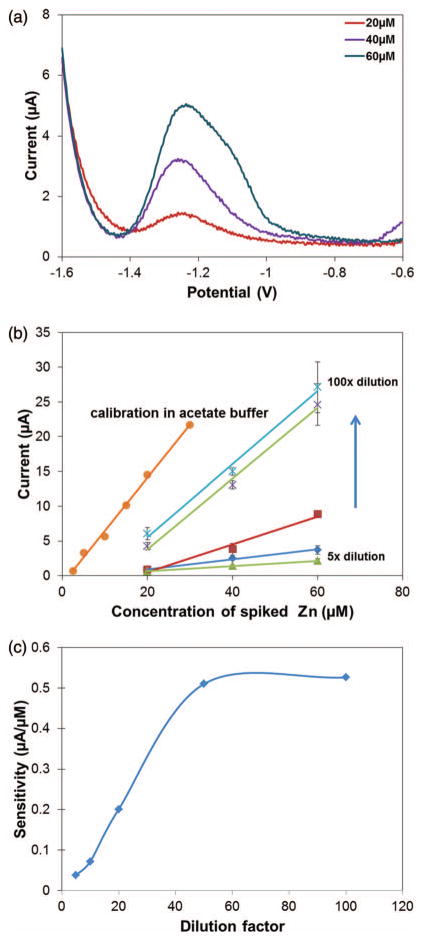
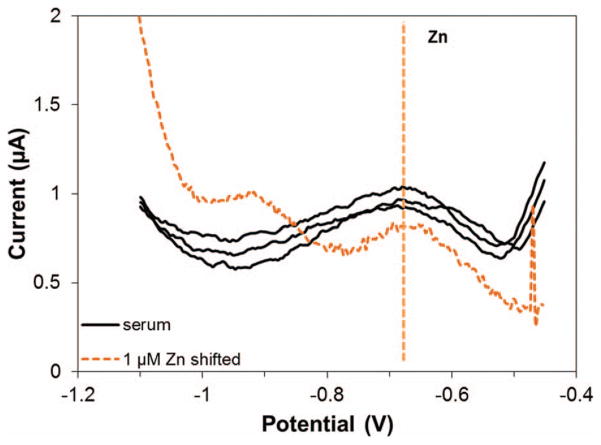
This work reports on the continuing development of a lab-on-a-chip electrochemical sensor for determination of zinc in blood serum using square wave anodic stripping voltammetry. The microscale sensor consists of a three electrode system, including an environmentally friendly bismuth working electrode, an integrated silver/silver chloride reference electrode, and a gold auxiliary electrode. The sensor demonstrates a linear response in 0.1 M acetate buffer at pH 6 for zinc concentrations in the 1-30 μM range. By optimizing bismuth film deposition and better control of the fabrication process, repeatability of the sensor was improved, reducing variability from 42% to <2%. Through optimization of electrolyte and stripping voltammetry parameters, limit of detection was greatly improved to 60 nM. The optimized sensor was also able to measure zinc in the extracted blood serum. Ultimately, with integrated sample preparation, the sensor will permit rapid (min) measurements of zinc from a sub-mL sample (a few drops of blood) for clinical applications.


Figures

Figure 1
Figure 1
(a) Photograph of the sensor with an interface for potentiostat connection. (b) Close-up of the electrochemical cell, illustrating configuration of the electrodes. (c) Schematic illustrating the ASV process. (d) Variation in peak current in repeated analysis on the same device. (e) Variation in peak current in repeated analysis using the first run of different devices. ASV performed in 20 μM Zn, 0.1 M acetate buffer (pH 6). Preconcentration potential −1.6 V, duration 600 s, amplitude 25 mV, period 70 ms, increment 4 mV.
Figure 2
Figure 2
Sensor fabrication process. Bi WEs were formed by either (a) electroplating or (b) evaporation.
Figure 3
Figure 3
Comparisons of surface morphologies of electroplated (top row) and evaporated (bottom row) Bi WEs: (a–b) microscopic photos and (c–d) optical profiler scans of each type of Bi WEs, respectively.
Figure 4
Figure 4
(a) Potential windows of electroplated and evaporated Bi, and Au WEs, with microfabricated Ag/AgCl RE and Au AE. Cyclic voltammetry performed in 0.1 M acetate buffer (pH 6) with scan rate 100 mV/s. (b) Threshold potential (i = 10 μA) of different WEs.
Figure 5
Figure 5
ASV of Zn (a) in the 2.5–30 μM range using electroplated Bi WE and (b) in the 1–30 μM range using evaporated Bi WE. Analyzes performed in acetate buffer (0.1 M, pH 6), 100 μL sample. Preconcentration potential −1.6 V, duration 600 s, amplitude 25 mV, period 70 ms, increment 4 mV. (c) Calibration curves for Zn in buffer using Bi WEs.
Figure 6
Figure 6
(a) Variations of peak currents in the first run of electroplated and evaporated Bi WEs. (b) Improvement of repeatability of sensors with electroplated Bi WE before and after optimization of fabrication procedure, and evaporated Bi WE. ASV performed repeatedly in 20 μM Zn, 0.1 M acetate buffer, pH 6 (n = 5 for electroplated Bi, n = 3 for evaporated Bi). Preconcentration potential −1.6 V, duration 600 s, amplitude 25 mV, period 70 ms, increment 4 mV.
Figure 7
Figure 7
(a) ASV of diluted (10×) serum spiked with 20–60 μM of Zn using electroplated Bi WEs, 200 μL sample. Preconcentration potential −1.6 V, duration 600 s, amplitude 25 mV, period 40 ms, increment 4 mV. (b) Calibration curves for Zn in diluted serum with dilution factor from 5× to 100×. (c) Relationship between sensor sensitivity and dilution factor of serum.
Figure 8
Figure 8
ASV in extracted serum using evaporated Bi WEs, 200 μL sample. Preconcentration potential −1.4 V, duration 900 s, amplitude 25 mV, period 40 ms, increment 4 mV.

Similar articles

Cited by

References

    1. Smith JC, Butrimovitz GP, Purdy WC. Clin Chem. 1979;25(8):1487. - PubMed
    1. Rahman S, Waheed S. J Radioanal Nucl Ch. 2009;279(3):915.
    1. Jenner GA, Longerich HP, Jackson SE, Fryer BJ. Chem Geol. 1990;83(1–2):133.
    1. Barany E, Bergdahl IA, Schütz A, Skerfving S, Oskarsson A. J Anal Atom Spectrom. 1997;12(9):1005.
    1. Wang J. Analytical Electrochemistry. John Wiley & Sons, Inc; Hoboken, New Jersey, USA: 2006.

LinkOut - more resources