Inhibition of Protein kinase Mzeta (PKMζ) in the mesolimbic system alters cocaine sensitization in rats
- PMID: 24729912
- PMCID: PMC3980506
- DOI: 10.4303/jdar/235669
Inhibition of Protein kinase Mzeta (PKMζ) in the mesolimbic system alters cocaine sensitization in rats
Abstract
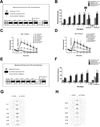
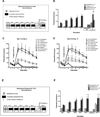
Chronic cocaine use produces long-lasting changes in reward circuits that may underlie the transition from casual to compulsive patterns of drug use. Although strong neuroadaptations within the mesocorticolimbic system are known to occur, the specific role of these drug-induced plasticities on sensitization remains to be elucidated. Here we investigate whether PKMζ, a protein involved in maintaining long-term potentiation (LTP), plays a role in these cocaine-induced changes in synaptic strengthening. We performed whole-cell voltage clamp recordings of putative ventral tegmental area (VTA) dopamine (DA) cells 24 hours after five days of 15 mg/kg i.p. cocaine or isovolumetric saline injections. We observed that superfusion of 5µM ZIP (PKMζ inhibitory peptide) decreased AMPA currents and AMPA/NMDA ratios only in cocaine sensitized rats. In vivo ZIP microinfusions (10 nmol) into the VTA after cocaine sensitization decreased locomotor activity on a subsequent cocaine challenge only if given ZIP is given before the withdrawal period. On the other hand, ZIP microinfusions into the nucleus accumbens (NAc) core after a seven days withdrawal period disrupt the expression of locomotor sensitization. The present data provide a potentially relevant region, and time-specific PKMζ-dependent brain mechanism that enables sensitization. Our results support the vision that addiction involves a pathological learning process. They imply that if this synaptic strengthening is reversed, changes in the behavioral response may also be overturned.
Keywords: AMPA/NMDA ratio; LTP; Protein kinase Mzeta; VTA; cocaine sensitization; dopamine.
Conflict of interest statement
Figures


Similar articles
-
aPKC-Mediated Persistent Increase in AMPA/NMDA Ratio in the VTA Participates in the Neuroadaptive Signal Necessary to Induce NAc Synaptic Plasticity After Cocaine Administration.Neuroscience. 2018 Nov 10;392:129-140. doi: 10.1016/j.neuroscience.2018.09.011. Epub 2018 Sep 21. Neuroscience. 2018. PMID: 30243909 Free PMC article.
-
Protein kinase mζ is necessary for cocaine-induced synaptic potentiation in the ventral tegmental area.Biol Psychiatry. 2012 Apr 15;71(8):706-13. doi: 10.1016/j.biopsych.2011.10.031. Epub 2011 Dec 9. Biol Psychiatry. 2012. PMID: 22153887
-
Application of a protein synthesis inhibitor into the ventral tegmental area, but not the nucleus accumbens, prevents behavioral sensitization to cocaine.Synapse. 1995 Jul;20(3):217-24. doi: 10.1002/syn.890200305. Synapse. 1995. PMID: 7570353
-
Cortical mechanisms of cocaine sensitization.Crit Rev Neurobiol. 2005;17(2):69-86. doi: 10.1615/critrevneurobiol.v17.i2.20. Crit Rev Neurobiol. 2005. PMID: 16808728 Review.
-
Comparison of cocaine- and methamphetamine-evoked dopamine and glutamate overflow in somatodendritic and terminal field regions of the rat brain during acute, chronic, and early withdrawal conditions.Ann N Y Acad Sci. 2001 Jun;937:93-120. doi: 10.1111/j.1749-6632.2001.tb03560.x. Ann N Y Acad Sci. 2001. PMID: 11458542 Review.
Cited by
-
Compensation for PKMζ in long-term potentiation and spatial long-term memory in mutant mice.Elife. 2016 May 17;5:e14846. doi: 10.7554/eLife.14846. Elife. 2016. PMID: 27187150 Free PMC article.
-
Ethanol dose-dependently elicits opposing regulatory effects on hippocampal AMPA receptor GluA2 subunits through a zeta inhibitory peptide-sensitive kinase in adolescent and adult Sprague-Dawley rats.Neuroscience. 2014 Nov 7;280:50-9. doi: 10.1016/j.neuroscience.2014.09.003. Epub 2014 Sep 16. Neuroscience. 2014. PMID: 25218807 Free PMC article.
-
Endogenous Regulator of G protein Signaling 14 (RGS14) suppresses cocaine-induced emotionally motivated behaviors in female mice.bioRxiv [Preprint]. 2024 Sep 15:2024.09.12.612719. doi: 10.1101/2024.09.12.612719. bioRxiv. 2024. PMID: 39314405 Free PMC article. Preprint.
-
Behavioral Tagging: A Translation of the Synaptic Tagging and Capture Hypothesis.Neural Plast. 2015;2015:650780. doi: 10.1155/2015/650780. Epub 2015 Aug 25. Neural Plast. 2015. PMID: 26380117 Free PMC article. Review.
-
aPKC-Mediated Persistent Increase in AMPA/NMDA Ratio in the VTA Participates in the Neuroadaptive Signal Necessary to Induce NAc Synaptic Plasticity After Cocaine Administration.Neuroscience. 2018 Nov 10;392:129-140. doi: 10.1016/j.neuroscience.2018.09.011. Epub 2018 Sep 21. Neuroscience. 2018. PMID: 30243909 Free PMC article.
References
-
- Anderson SM, Famous KR, Sadri-Vakili G, Kumaresan V, Schmidt HD, Bass CE, Terwilliger EF, Cha JH, Pierce RC. CaMKII: a biochemical bridge linking accumbens dopamine and glutamate systems in cocaine seeking. Nature neuroscience. 2008;11:344–353. - PubMed
-
- Bellone C, Luscher C. Cocaine triggered AMPA receptor redistribution is reversed in vivo by mGluR-dependent long-term depression. Nature neuroscience. 2006;9:636–641. - PubMed
-
- Berke JD, Hyman SE. Addiction, dopamine, and the molecular mechanisms of memory. Neuron. 2000;25:515–532. - PubMed
-
- Bird MK, Reid CA, Chen F, Tan HO, Petrou S, Lawrence AJ. Cocaine-mediated synaptic potentiation is absent in VTA neurons from mGlu5-deficient mice. The international journal of neuropsychopharmacology / official scientific journal of the Collegium Internationale Neuropsychopharmacologicum. 2010;13:133–141. - PubMed
Grants and funding
LinkOut - more resources
Full Text Sources
Other Literature Sources
