Review
. 2015 Feb 10;22(5):424-48.
doi: 10.1089/ars.2014.5933. Epub 2014 Jun 20.

The therapeutic potential of cystathionine β-synthetase/hydrogen sulfide inhibition in cancer

Affiliations
Review

The therapeutic potential of cystathionine β-synthetase/hydrogen sulfide inhibition in cancer

Mark R Hellmich et al. Antioxid Redox Signal. .

Abstract

Significance: Cancer represents a major socioeconomic problem; there is a significant need for novel therapeutic approaches targeting tumor-specific pathways.

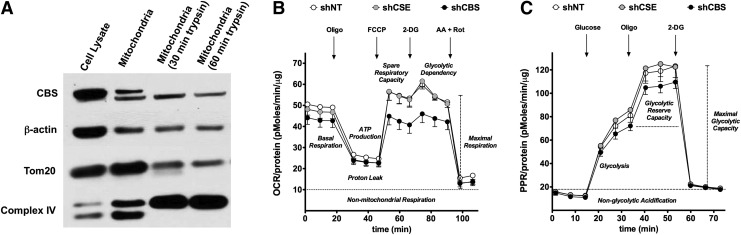
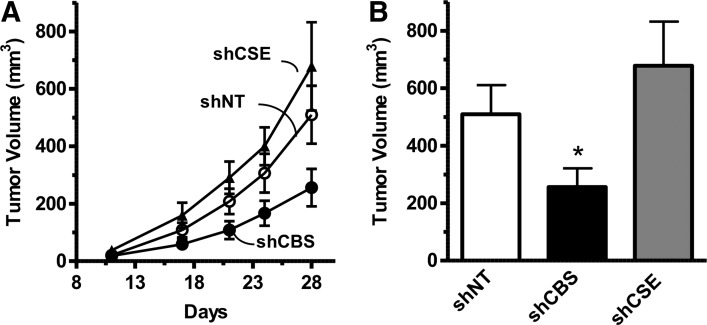
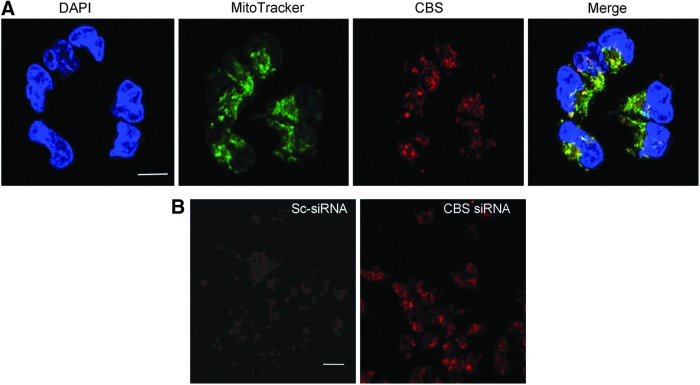
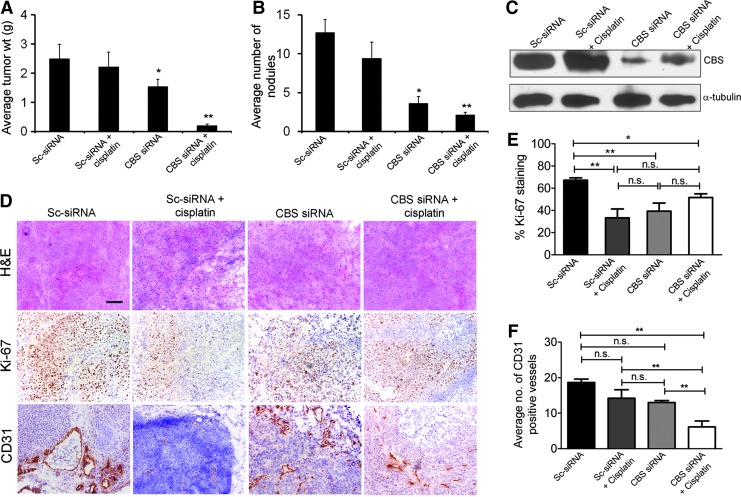
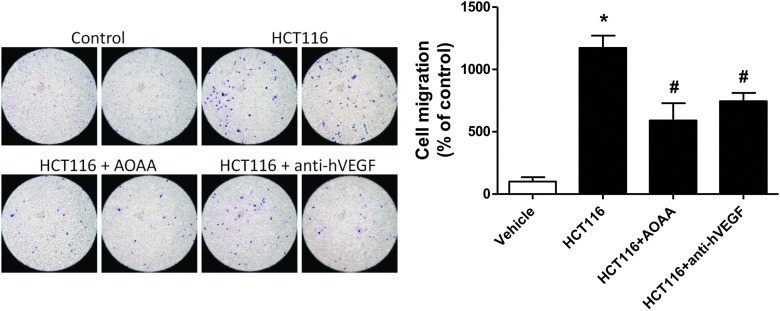
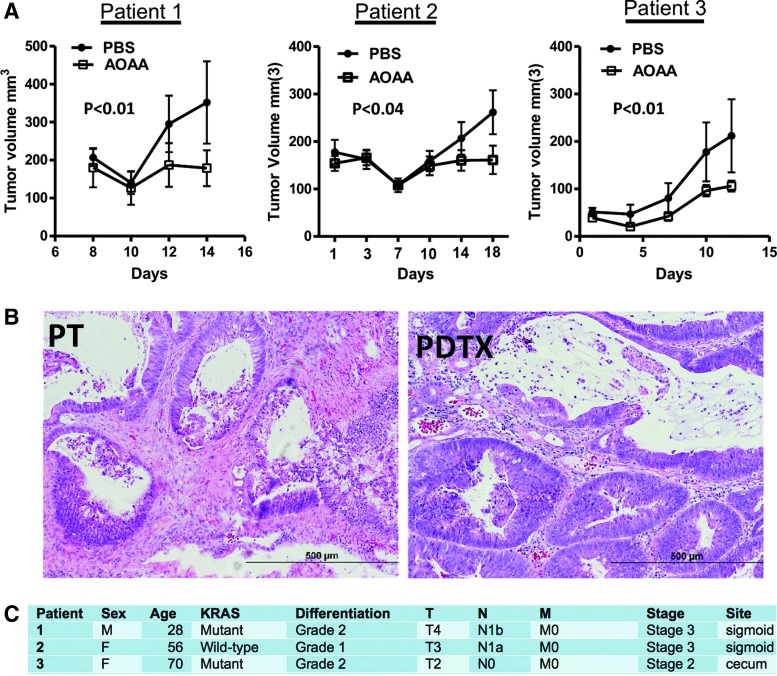
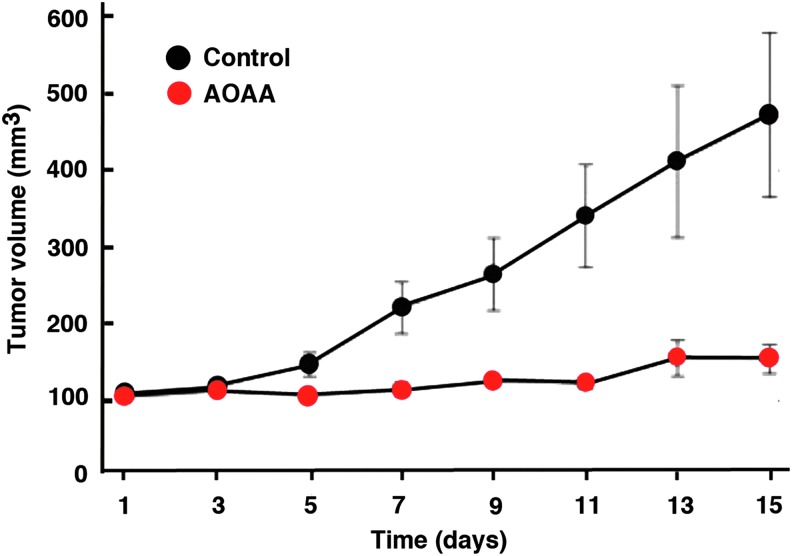
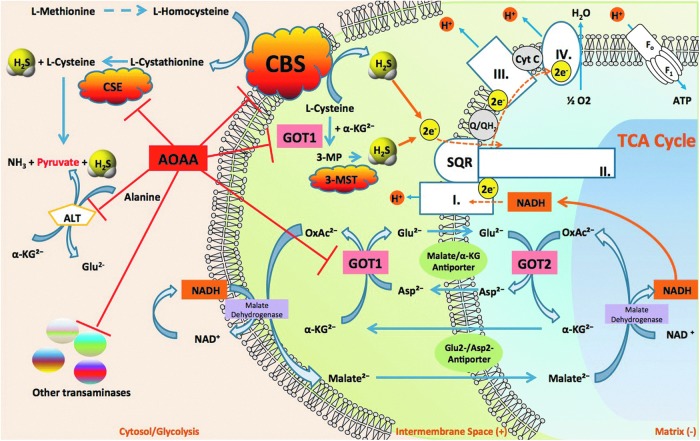
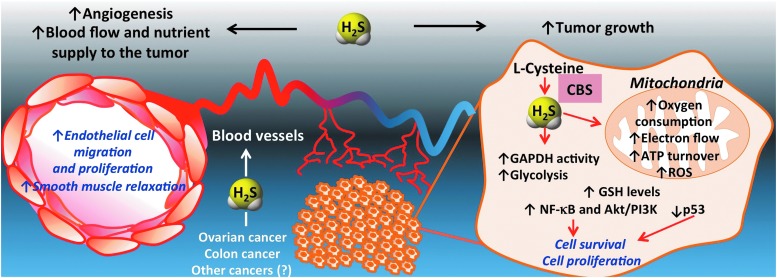
Recent advances: In colorectal and ovarian cancers, an increase in the intratumor production of hydrogen sulfide (H2S) from cystathionine β-synthase (CBS) plays an important role in promoting the cellular bioenergetics, proliferation, and migration of cancer cells. It also stimulates peritumor angiogenesis inhibition or genetic silencing of CBS exerts antitumor effects both in vitro and in vivo, and potentiates the antitumor efficacy of anticancer therapeutics.

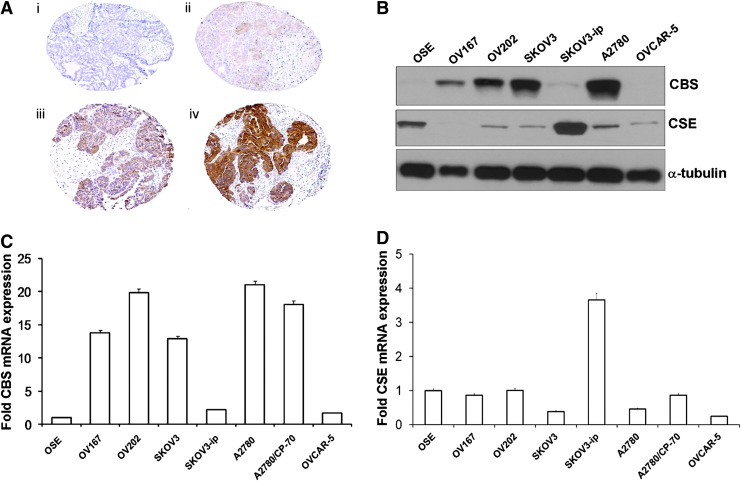
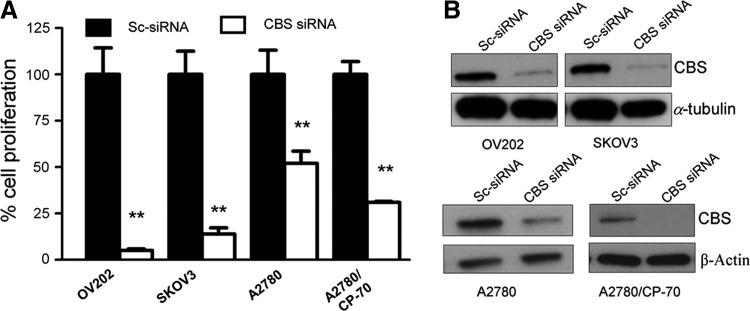
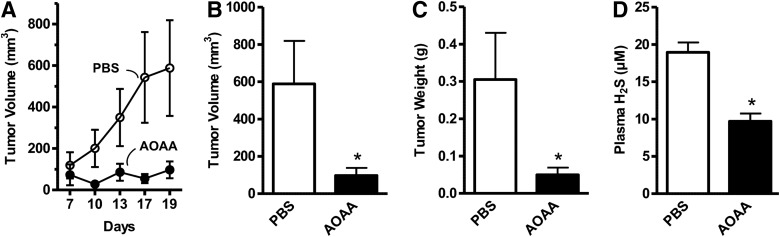
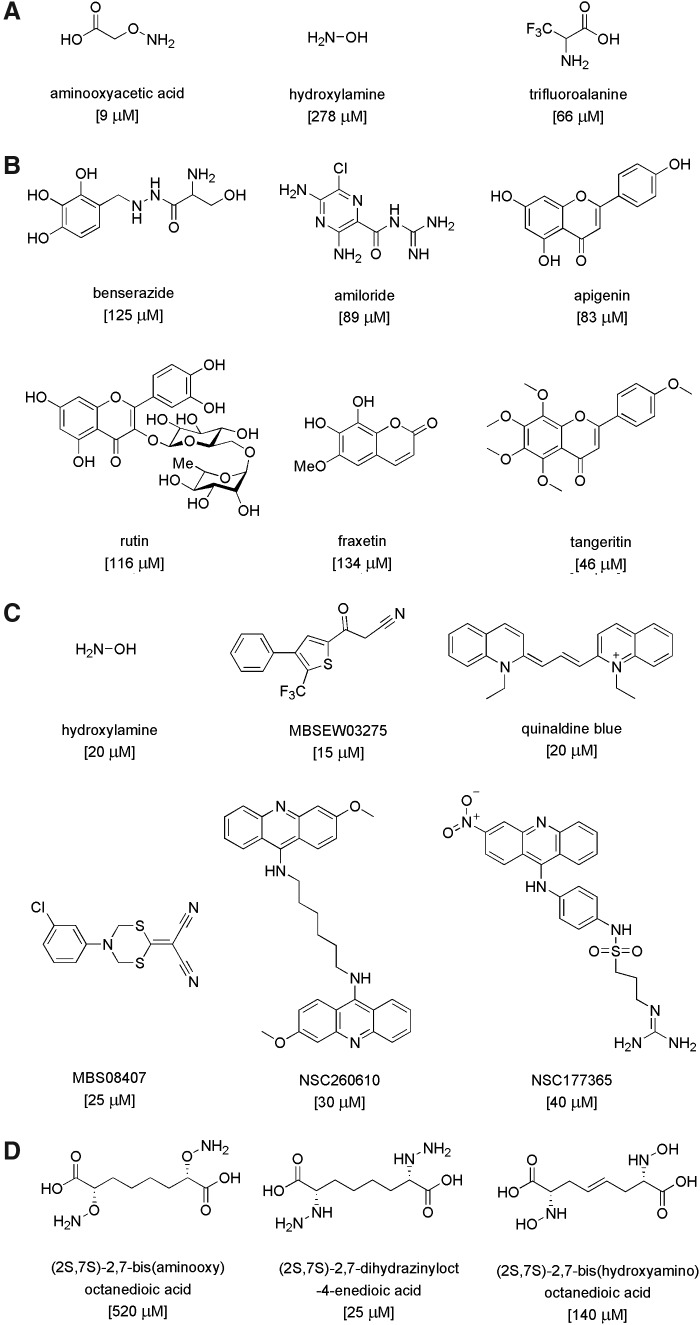
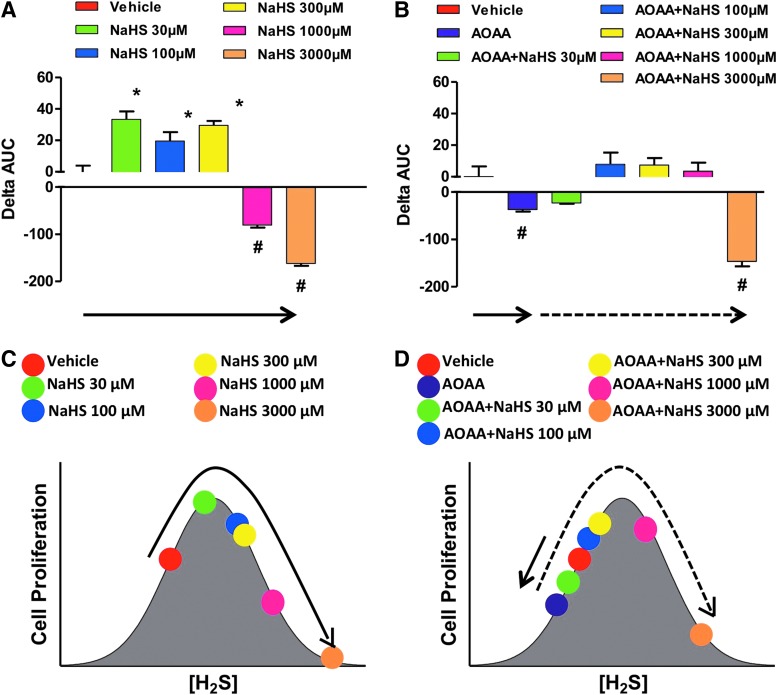
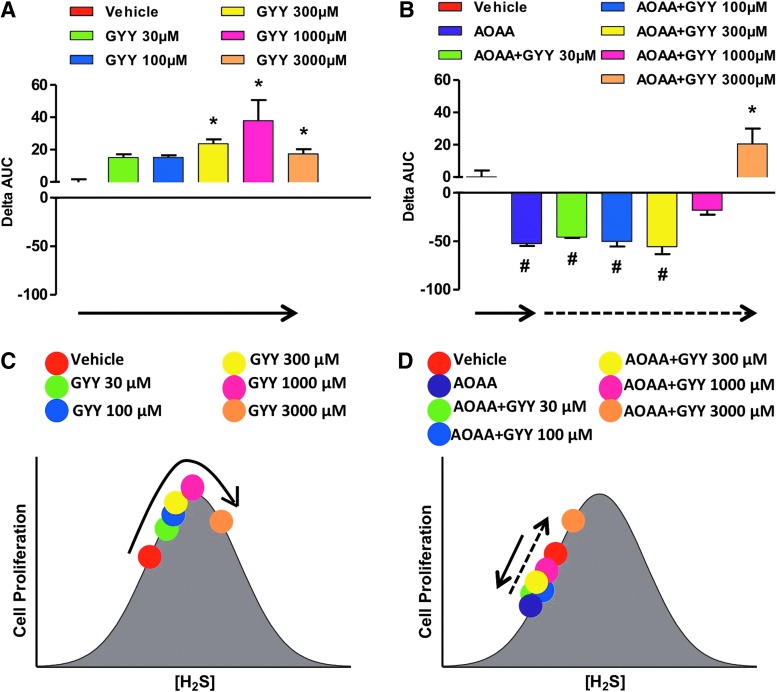
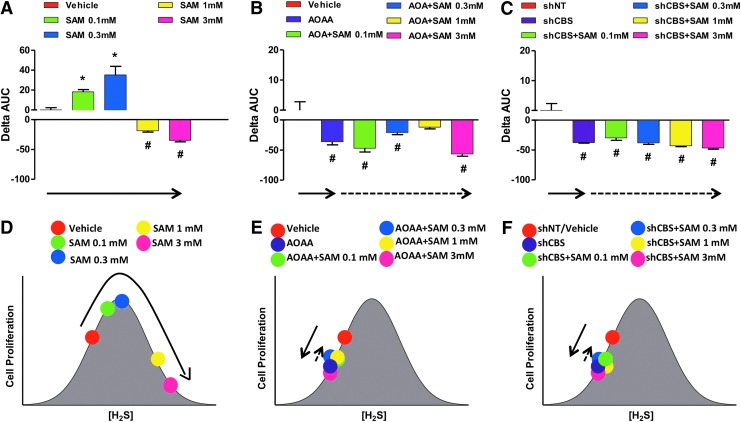
Critical issues: Recently published studies are reviewed, implicating CBS overexpression and H2S overproduction in tumor cells as a tumor-growth promoting "bioenergetic fuel" and "survival factor," followed by an overview of the experimental evidence demonstrating the anticancer effect of CBS inhibition. Next, the current state of the art of pharmacological CBS inhibitors is reviewed, with special reference to the complex pharmacological actions of aminooxyacetic acid. Finally, new experimental evidence is presented to reconcile a controversy in the literature regarding the effects of H2S donor on cancer cell proliferation and survival.

Future directions: From a basic science standpoint, future directions in the field include the delineation of the molecular mechanism of CBS up-regulation of cancer cells and the delineation of the interactions of H2S with other intracellular pathways of cancer cell metabolism and proliferation. From the translational science standpoint, future directions include the translation of the recently emerging roles of H2S in cancer into human diagnostic and therapeutic approaches.


Figures

<b>FIG. 1.</b>
FIG. 1.
Domains and prosthetic groups of cystathionine β-synthase (CBS). (A) The modular domain structure of human CBS showing the N-terminal domain that binds heme, the catalytic domain, and the C-terminal regulatory domain which contains two “CBS” domains, CBS1 and CBS2. Reproduced by permission (77). (B) A model of hCBS activation, as recently proposed by Ereño-Orbea et al. Ribbon (a) and surface (b) representations of a model of the activated form of hCBS on binding of S-adenosyl-L-methionine (SAM) at site S2. The loops controlling the access to the pyridoxal-phosphate (PLP) cavity (a: L191–202; b: L171–174; c: L145–148) are open, thus enabling the access of substrates. Ribbon (c) and surface (d) representations of the basal form of hCBS obtained from the crystals. The loops controlling access to the PLP cavity are closed and occlude the entrance of substrates into the catalytic cavity. Reproduced by permission (28). To see this illustration in color, the reader is referred to the web version of this article at www.liebertpub.com/ars
<b>FIG. 2.</b>
FIG. 2.
Reactions catalyzed by CBS. Part (A) represents a β-replacement reaction, which is estimated to exhibit a turnover number (v/[E]), estimated at physiological substrate concentrations, [10 μM homocysteine, 100 μM cysteine, 560 μM serine, and 5μM cystathionine]) at 18.5×10⁻³ s−1. Part (B) represents an α,β-elimination reaction, with an estimated turnover number of 8.1×10⁻³ s−1 under the conditions outlined in part (A). Part (C) represents a β-replacement reaction, with an estimated turnover number of 1.8×10⁻⁶ s−1 under the conditions outlined in part (A). Part (D) represents a β-replacement reaction, with an estimated turnover number of 0.029×10⁻⁶ s−1 under the conditions outlined in part (A). Modified from (108) by permission.
<b>FIG. 3.</b>
FIG. 3.
CBS is highly expressed in human colorectal cancer. (A) Representative Western blot of CBS, cystathionine γ-lyase (CSE), and 3-mercaptopyruvate sulfurtransferase (3-MST) protein expression in human colorectal cancer specimens, paired with the corresponding normal mucosa tissues. Polyvinylidene difluoride membranes were probed with rabbit polyclonal antibodies against CBS, CSE, and 3-MST. (B) Densitometric analyses of CBS expression, in seven pairs of human colorectal cancers and the patient-matched normal mucosa, showed an approximately sevenfold increase in CBS protein expression in colon cancer (arbitrary relative densitometric units were normalized with β-actin using image analysis software) (*p<0.05 vs. normal mucosa). (C, D) CBS was highly expressed in three different colon cancer cell lines (LoVo, HCT116, and HT29), while low expression was detected in the nontumorigenic normal colon mucosa cells (NCM356) (arbitrary relative densitometric units were normalized with β-actin using image analysis software) (*p<0.05 vs. NCM356 cells). Hydrogen sulfide (H2S) production was measured in human colorectal cancer specimens (E) and in colon cancer cell lines (F) by the methylene blue method. H2S production was stimulated in tissue or cell lysates by incubation at 37°C (30 min) in the presence of the CBS substrates L-cysteine (3 mM) and L-homocysteine (0.5 mM). CBS activity was significantly higher in colon cancer tissues, compared with their corresponding controls. Aminooxyacetic acid (AOAA) (1 mM) blocked the H2S-producing activity of CBS in the tissue extracts (*p<0.05 vs. corresponding from normal mucosa and #p<0.05 vs. vehicle), whereas the CSE inhibitor propargylglycine (PAG) (3 mM) had no significant effect. HCT116 cells exhibited the highest rate of H2S production, as measured by the methylene blue method in cell lysates (*p<0.05 vs. corresponding values in NCM356 and #p<0.05 vs. vehicle). Reproduced by permission (117).
<b>FIG. 4.</b>
FIG. 4.
CBS silencing inhibits the proliferation of human colorectal cancer cells, while CBS overexpression stimulates the proliferation of nontumorigenic normal colonic mucosa cells. (A) The lentiviral shRNA vectors targeting CBS (shCBS) and CSE (shCSE) were transfected into HCT116 cells. A nontargeting sequence was used as control (shNT). The shRNA approach inhibited the expression of both CBS and CSE genes at the protein level, as shown by Western blotting (inset). After CBS and CSE silencing, cells were seeded at the density of 3000 cells per well in xCELLigence plates and proliferation was monitored for 36 h. Down-regulation of CBS, but not CSE, significantly reduced HCT116 proliferation rate. (B) Adenoviral-mediated CBS overexpression enhances the proliferation rate of NCM356 cells. The NCM356 cells were infected overnight with a CBS expressing adenovirus (Ad-CBS, 10 multiplicities of infection) or its control, a green fluorescent protein (Ad-GFP). The culture medium was then replaced, and cells were seeded in XCELLigence plates at 3000 cells per well. Cell proliferation was then measured in real-time over 36 h. Effective overexpression of CBS was detected within 12–24 h after infection (inset). Adenoviral-mediated CBS overexpression significantly enhanced NCM356 cell proliferation. Reproduced by permission (117).
<b>FIG. 5.</b>
FIG. 5.
CBS is present in the mitochondria of human colorectal cancer cells and stimulates cellular bioenergetics. (A) Western blot shows the presence of CBS in mitochondrial isolates of HCT116 cells. Limited trypsin digestion of isolated mitochondria (30–60 min) reduced mitochondrial CBS, as well as the mitochondrial outer membrane protein Tom20, while enriching complex IV (an inner membrane protein). (B) ShRNA-mediated down-regulation of CBS suppresses cellular bioenergetics in HCT116 cells. Oxygen consumption rate (OCR) in HCT116 cells subjected to either nontargeting (shNT, control) or stable lentiviral silencing of CBS or CSE (shCBS, shCSE). shCBS enzyme significantly decreased basal OCR, calculated ATP production, maximal respiration, and spare respiratory capacity whereas CSE silencing had no effect on the bioenergetic profile. (C) CBS silencing attenuates glycolysis in HCT116 cells. The figure shows time-dependent Extracellular Flux Analysis. shCBS significantly diminished the maximal glycolytic capacity and the glycolytic reserve capacity, whereas CSE silencing had no effect on the glycolytic parameters. Reproduced by permission (117).
<b>FIG. 6.</b>
FIG. 6.
ShRNA-mediated down-regulation of CBS inhibits colon cancer growth in vivo. (A) Effects of shRNA-mediated gene silencing of CBS (shCBS) and CSE (shCSE) on HCT116 tumor xenograft when compared with the control response (shNT, nontargeting shRNA control). (B) CBS silencing resulted in a reduction of tumor volume at harvest (*p=0.04). Reproduced by permission (117).
<b>FIG. 7.</b>
FIG. 7.
CBS is highly expressed in human ovarian cancer. (A) Immunohistochemical staining of a tissue microarray of epithelial ovarian cancer samples. Representative images are shown of none (i), weak (ii), moderate (iii), and (iv) strong staining. (B) Expression of CBS and CSE in various ovarian cell lines as determined by immunoblotting. α-Tubulin was used as the loading control. (C) Real-time polymerase chain reaction (RT-PCR) data showing the expression of CBS mRNA in various ovarian cell lines. (D) RT-PCR data showing the expression of CSE mRNA in various ovarian cell lines. Reproduced by permission (10). To see this illustration in color, the reader is referred to the web version of this article at www.liebertpub.com/ars
<b>FIG. 8.</b>
FIG. 8.
CBS silencing inhibits the proliferation of human ovarian cancer cells. (A) Effect of CBS knockdown on the proliferation of OV202, SKOV3, A2780, and A2780/CP-70 cells. (B) Immunoblotting data to determine the extent of siRNA-mediated knockdown. (**p<0.01 shows significant inhibition of cell proliferation by CBS siRNA.) Reproduced by permission (10).
<b>FIG. 9.</b>
FIG. 9.
CBS is present in the mitochondria of human ovarian cancer cells, and its silencing increases mitochondrial reactive oxygen species production. (A) Localization of CBS in A2780 cells determined by immunofluorescence using confocal microscopy. Nuclear stain with DAPI (blue channel), CBS (red channel), and MitoTracker green (green channel) was used to label mitochondria. Scale bar is 10 μm. (B) MitoSOX staining in live A2780 cells shows the buildup of mitochondrial superoxide on silencing CBS. Scale bar is 30 μm. Reproduced by permission (10). To see this illustration in color, the reader is referred to the web version of this article at www.liebertpub.com/ars
<b>FIG. 10.</b>
FIG. 10.
SiRNA-mediated down-regulation of CBS inhibits ovarian cancer growth in vivo and synergizes with cisplatin therapy. To assess the effects of siRNA therapy on tumor growth, treatment was initiated at 1 week after i.p. injection of tumor cells. Mice were divided into four groups: (i) control siRNA-dioleoyl phosphatidylcholine (DOPC) (150 mg/kg i.p. twice weekly), (ii) control siRNA-DOPC (150 mg/kg i.p. twice weekly)+cisplatin (160 mg/mouse i.p. weekly), (iii) CBS siRNA-DOPC (150 mg/kg i.p. twice weekly), and (iv) CBS siRNA-DOPC (150 mg/kg i.p. twice weekly)+cisplatin ((160 mg/mouse i.p. weekly). Treatment was continued until 4 weeks after tumor inoculation before sacrifice. (A) Mouse and tumor weights and (B) the number of tumor nodules for each group were compared using Student's t-test with p<0.05 considered statistically significant. (C) Immunoblotting of tumor samples for confirmation of CBS knockdown. One animal from each group was selected for immunoblotting analysis. (D) Representative histology of tumors from mice xenografts of A2780/CP-20 cells with Ki-67 expression (middle row) and CD31 expression (lower row) acquired at 20×magnification. Scale bar represents 100 μm. (E) and (F) Quantification of Ki-67 staining and CD31 staining in the mouse xenografts, respectively (n=4). Statistical analysis was determined using one-way ANOVA with *p<0.05 and **p<0.01. Reproduced by permission (10). To see this illustration in color, the reader is referred to the web version of this article at www.liebertpub.com/ars
<b>FIG. 11.</b>
FIG. 11.
Both AOAA and vascular endothelial growth factor (VEGF) neutralization inhibit tumor-induced endothelial cell migration. Tumor-induced endothelial cell migration was tested in vitro in a co-culture assay involving human umbilical endothelial cells (EAhy926) and human colon cancer cells (HCT116). HCT116 cells were seeded to confluence in the lower chamber of a 6.5 mm Transwell insert (8.0 μm pore); while EAhy926 were serum starved for 5 h, detached by Trypsin-EDTA, re-suspended in serum-free media, and added to the upper chamber (105 cells/well). Cells were allowed to migrate for 4 h. Migrated cells were fixed with Carson's fixative, stained by 0.33% Toluidine blue, and quantified by visual counting. AOAA (1 mM) and antihuman VEGF polyclonal antibody (5 μg/ml) were added to the HCT116 culture at 45 min (37°C) before the addition of the endothelial cells to the upper chamber (*p<0.05 vs. vehicle and #p<0.05 vs. HCT116). The comparable degree of inhibition of endothelial cell migration by AOAA and of VEGF neutralization should be noted. To see this illustration in color, the reader is referred to the web version of this article at www.liebertpub.com/ars
<b>FIG. 12.</b>
FIG. 12.
AOAA inhibits HCT116 colon cancer growth in vivo. Effects of AOAA or its vehicle (phosphate-buffered saline [PBS]) on HCT116 tumor xenografts' (A) growth rate, (B) tumor volume (*p=0.02), (C) wet weight (*p=0.001), and (D) plasma concentrations of H2S (*p=0.0005). Reproduced by permission (117).
<b>FIG. 13.</b>
FIG. 13.
AOAA inhibits colon cancer growth in patient-derived tumor xenografts (PDTX) in vivo. (A) Effects of AOAA or its vehicle (PBS) on PDTX growth rate in three different patients. p<0.05 was considered statistically significant. (B) Photomicrographs of H&E-stained formalin-fixed paraffin-embedded sections (5 μm) of the primary colon adenocarcinoma from a patient with stage III disease and Kras mutation (PT), and the corresponding PDTX. The similar morphology of both specimens should be noted. (C) Patient information with regard to sex, age, KRAS mutation status, differentiation, tumor severity grade/stage, and tumor localization. PDTX data from patients 1 and 2 are reproduced by permission (117). To see this illustration in color, the reader is referred to the web version of this article at www.liebertpub.com/ars
<b>FIG. 14.</b>
FIG. 14.
AOAA inhibits breast cancer growth in vivo. MDA-MB-231 xenografts were initiated in nude mice. Tumors were measured daily using blunt end Vernier calipers, and mice with established tumors (130–190 mg) were blindly randomized into either PBS control (black symbols) or AOAA treatment (red symbols) groups. Experimental mice were weighed, and they were given daily intraperitoneal injections of either PBS or 0.2 mg AOAA. Data are plotted as the mean±SD. It should be noted that AOAA markedly suppressed the growth of established breast cancer tumors. Reproduced by permission (124). To see this illustration in color, the reader is referred to the web version of this article at www.liebertpub.com/ars
<b>FIG. 15.</b>
FIG. 15.
Pharmacological inhibitors of CBS. (A) shows the comparative potency of previously known CBS inhibitors, as determined by the “methylene blue” assay by Asimakopoulou and colleagues at the University of Patras and UTMB Galveston (5). (B) shows newly identified CBS inhibitors identified by a screen utilizing a fluorescent H2S detection method by Thornburg et al. at the University of Utah and the University of Colorado at Denver (125). (C) shows newly identified CBS inhibitors identified by Zhao and colleagues at the Shanghai Jiao Tong University [Shanghai, China (147)] using a fluorescent H2S detection method, and the potency of the previously known inhibitor, hydroxylamine, in the same assay. (D) shows the most potent CBS inhibitors synthesized by rational design by Shen at the University of Nebraska (105) and tested in a radioactive CBS assay. All assays used human recombinant CBS enzyme. Structures of the inhibitors, names, and IC50 values in brackets are shown. Due to differences in the assay conditions, inhibitory potencies of the compounds should be compared within the same assay, but not within assays.
<b>FIG. 16.</b>
FIG. 16.
Multiple pharmacological actions of AOAA. By simultaneously inhibiting CBS activity and inhibiting glutamate oxaloacetate transaminase 1 (GOT1), a key enzyme of the malate/aspartate shuttle, AOAA acts as an inducer of “synthetic lethality” in cancer cells. CBS-derived H2S supports mitochondrial electron transport and cancer cell bioenergetics by donating electrons at complex II. By inhibiting CBS, AOAA suppresses this bioenergetic pathway. The malate-aspartate shuttle translocates electrons that are produced in glycolysis across the semipermeable inner membrane of the mitochondrion, in order to support oxidative phosphorylation. These electrons enter the electron transport chain at complex I. The shuttle system is required, because the mitochondrial inner membrane is impermeable to NADH (a primary reducing equivalent of the electron transport chain). In humans, the cytoplasmic enzyme (GOT1) is one of the key enzymes in the malate shuttle: It functions to catalyze the interconversion of aspartate and α-ketoglutarate to oxaloacetate and glutamate using PLP as a cofactor. By inhibiting GOT1, AOAA reduces the transfer of electron donors to the mitochondria, thereby suppressing cancer cell bioenergetics. By the simultaneous inhibition of CBS and GOT1, AOAA interferes with two key pathways of cancer cell mitochondrial function. In addition, by inhibiting G0T1 (also termed CAT), AOAA may have additional inhibitory effects on mitochondrial H2S production by reducing the substrate level of 3-MST and thereby indirectly inhibiting its activity. Moreover, AOAA may also inhibit several additional PLP-dependent enzymes in the cell, including the cytosolic enzyme CSE. To see this illustration in color, the reader is referred to the web version of this article at www.liebertpub.com/ars
<b>FIG. 17.</b>
FIG. 17.
Bell-shaped effect of the fast-acting H2S donor NaHS on the proliferation of HCT116 cells in the absence or presence of AOAA. (A, B) show the effect of various concentrations of NaHS on proliferation. The HCT116 cell proliferation was assessed in real time for approximately 72 h using the xCELLigence system as described (117), and the effect of the H2S donor was calculated as the change in the area under the curve (0–72 h) relative to the proliferation of vehicle-treated cells. In this analysis, the ΔAUC of the cells in the presence of vehicle only is defined as zero. Columns that are oriented in the positive direction represent increases in proliferation in response to the H2S donor compared with vehicle (*p<0.05); negative columns represent the inhibitory effect of NaHS on cell proliferation (#p<0.05). (C, D) show the interpretation of the findings based on a bell-shaped dose-response model. (A, C) as well as (B, D) are color-coordinated to represent identical experimental groups. See “H2S Donation vs. H2S Biosynthesis Inhibition in Cancer” for additional explanation of the model. Data represent mean±SEM of n=4 independent determinations. To see this illustration in color, the reader is referred to the web version of this article at www.liebertpub.com/ars
<b>FIG. 18.</b>
FIG. 18.
Bell-shaped effect of the slow-acting H2S donor GYY4137 on the proliferation of HCT116 cells in the absence or presence of AOAA. The effect of GYY4137 on HCT116 cell proliferation is shown (A, B). Cell proliferation was monitored for approximately 72 h by xCELLigence system as described (117). The xCELLigence enables real-time monitoring of the cell status and is carried out in a specially designed 96-well plate containing microelectrodes to measure the impedance of the cell monolayer, also called cell index (CI). Curves of the CI over time were obtained, and the effect of the H2S donor was calculated as relative change in the area under the curve (0–72 h) over the vehicle-treated cells. In this analysis, the ΔAUC of vehicle-treated cells is defined as zero. Positive or negative values represent, respectively, increases or decreases in HCT116 cell proliferation in response to the H2S donor compared with vehicle (*p<0.05 and #p<0.05). (C, D) shows the interpretation of the findings based on a bell-shaped dose-response model. (A, C) as well as (B, D) are color-coordinated to represent identical experimental groups. See “H2S Donation Versus H2S Biosynthesis Inhibition in Cancer” for additional explanation of the model. Data represent mean±SEM of n=4 independent determinations. To see this illustration in color, the reader is referred to the web version of this article at www.liebertpub.com/ars
<b>FIG. 19.</b>
FIG. 19.
Bell-shaped effect of the allosteric CBS activator SAM on the proliferation of HCT116 cells, and loss of the pharmacological effect of SAM in cells pretreated with AOAA or in cells with stable lentiviral silencing of CBS (shCBS). (A–C) show the effect of various concentrations of SAM on colon cancer cell proliferation either in basal conditions or on pharmacological inhibition/shRNA-mediated silencing of CBS. The assay was conducted using the xCELLigence system as described (117), and the effect of the CBS allosteric modulator was calculated as relative change in the area under the curve of the index of cell proliferation over time (0–72 h). In this analysis, the ΔAUC for the vehicle-treated cells is defined as zero. Columns that are oriented in the positive direction represent increases in proliferation in response to SAM compared with vehicle (*p<0.05); negative columns represent inhibition of proliferation compared with the vehicle-treated control cells (#p<0.05). (D–F) show the interpretation of the findings based on a bell-shaped dose-response model. (A, D), (B, E) as well as (C, F) are color-coordinated to represent identical experimental groups. See “H2S Donation Versus H2S Biosynthesis Inhibition in Cancer” for an additional explanation of the model. Data represent mean±SEM of n=4 independent determinations. To see this illustration in color, the reader is referred to the web version of this article at www.liebertpub.com/ars
<b>FIG. 20.</b>
FIG. 20.
Summary: role of CBS/H2S axis in the biology of colorectal and ovarian cancer cells. CBS is highly expressed in colon cancer cells, ovarian cancer cells (and likely in other forms of cancer as well). It is located partially in the cytosol and partially in the mitochondria. H2S produced from it serves as an inorganic electron donor, stimulating mitochondrial electron transport, increasing ATP turnover. In addition, H2S increases the glycolytic activity of the tumor cell, presumably by activating GAPDH. Moreover, it exerts antioxidant effects in the mitochondria. In addition, it contributes to the maintenance of GSH in the cancer cell. Via autocrine bioenergetic effects, and/or via direct effects on multiple signaling pathways (Akt/PI3K, nuclear factor kappa B [NF-κB] etc.), endogenously produced H2S stimulates cancer cell proliferation, migration, and invasion. In addition, H2S diffuses into the surrounding cells and tissues, stimulating angiogenesis, as well as acting as a vascular relaxant. Via these paracrine effects, CBS-derived H2S promotes the supply of blood and nutrients to the tumor. Genetic silencing or pharmacological inhibition of CBS exerts inhibitory effects on tumor bioenergetics, cellular signaling, resulting in inhibition of proliferation, growth, migration, and metastasis. CBS inhibition also enhances the antitumor effect of various chemotherapeutic agents such as cisplatin and oxaliplatin both in vitro and in vivo. Modified from Szabo et al. (117). To see this illustration in color, the reader is referred to the web version of this article at www.liebertpub.com/ars

References

    1. Abe K. and Kimura H. The possible role of hydrogen sulfide as an endogenous neuromodulator. J Neurosci 16: 1066–1071, 1996 - PMC - PubMed
    1. Abraham JM. and Cho L. The homocysteine hypothesis: still relevant to the prevention and treatment of cardiovascular disease? Cleve Clin J Med 77: 911–918, 2010 - PubMed
    1. Akahoshi N, Kobayashi C, Ishizaki Y, Izumi T, Himi T, Suematsu M, and Ishii I. Genetic background conversion ameliorates semi-lethality and permits behavioral analyses in cystathionine beta-synthase-deficient mice, an animal model for hyperhomocysteinemia. Hum Mol Genet 17: 1994–2005, 2008 - PubMed
    1. Altomare DF, Di Lena M, Porcelli F, Trizio L, Travaglio E, Tutino M, Dragonieri S, Memeo V, and de Gennaro G. Exhaled volatile organic compounds identify patients with colorectal cancer. Br J Surg 100: 144–150, 2013 - PubMed
    1. Asimakopoulou A, Panopoulos P, Chasapis CT, Coletta C, Zhou Z, Cirino G, Giannis A, Szabo C, Spyroulias GA, and Papapetropoulos A. Selectivity of commonly used pharmacological inhibitors for cystathionine β synthase (CBS) and cystathionine γ lyase (CSE). Br J Pharmacol 169: 922–932, 2013 - PMC - PubMed

Publication types

MeSH terms

LinkOut - more resources