. 2014 Aug;40(4):1425-39.
doi: 10.1037/a0036151. Epub 2014 Apr 14.

Dual-route model of the effect of head orientation on perceived gaze direction

Affiliations
Free PMC article

Dual-route model of the effect of head orientation on perceived gaze direction

Yumiko Otsuka et al. J Exp Psychol Hum Percept Perform. 2014 Aug.
Free PMC article

Abstract

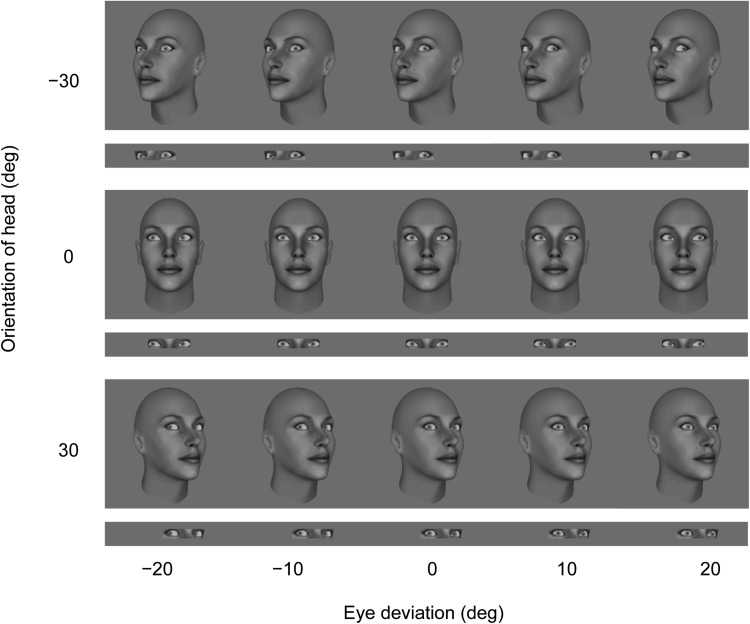
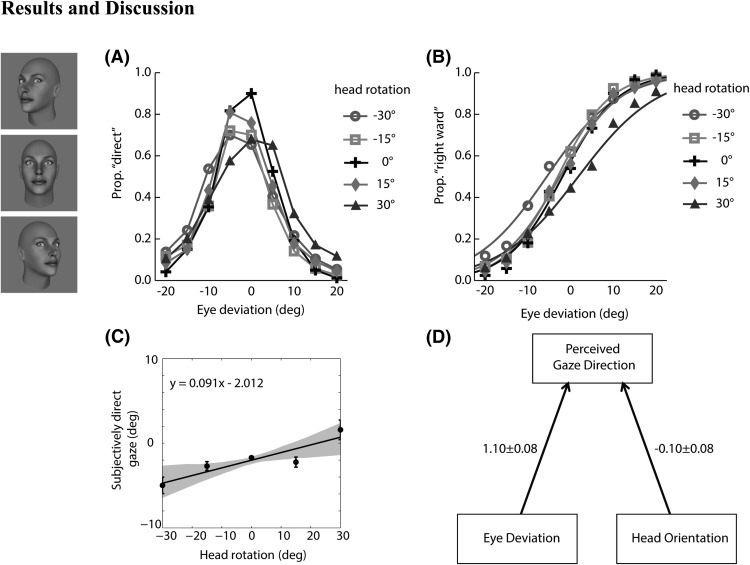
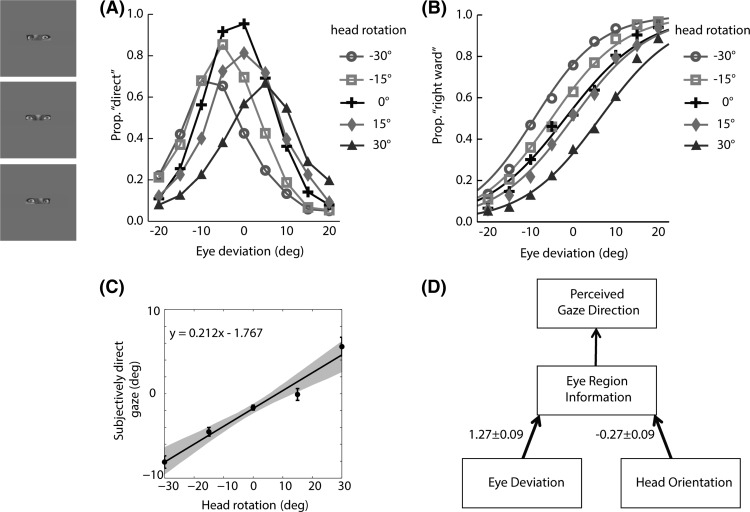
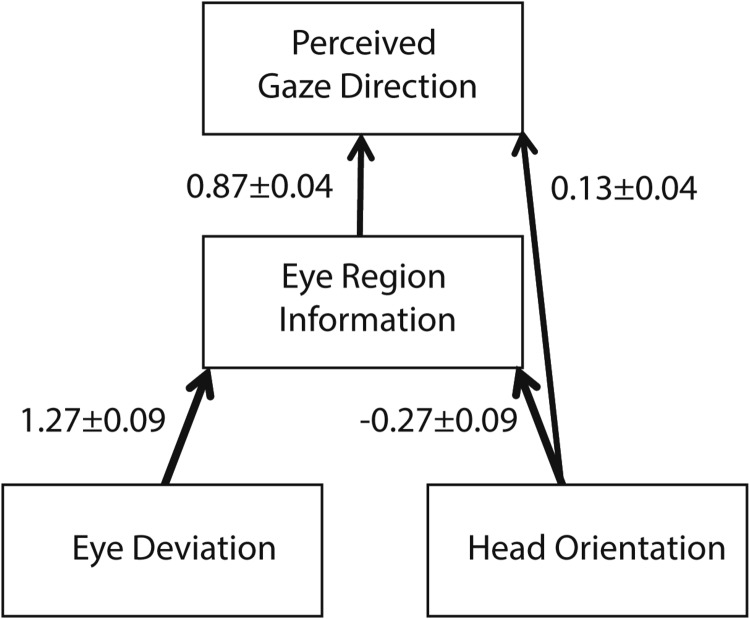
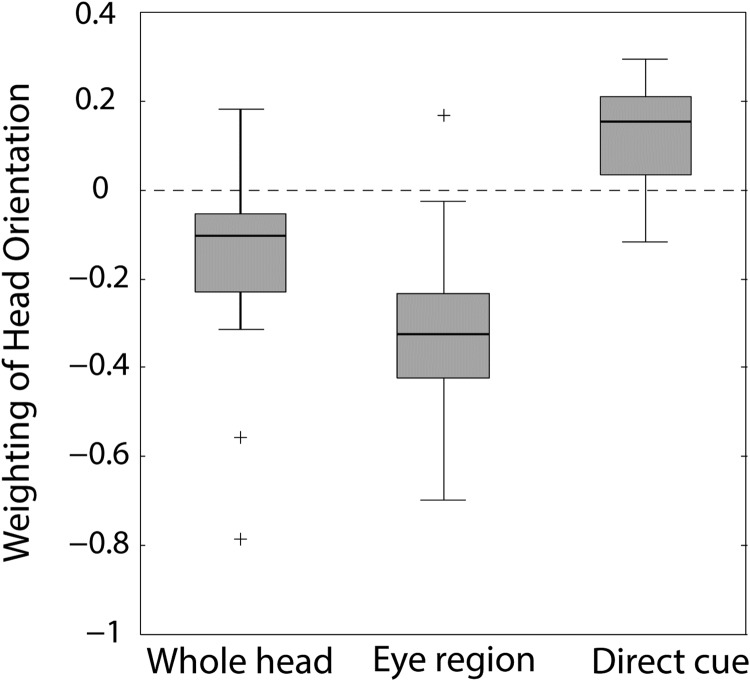
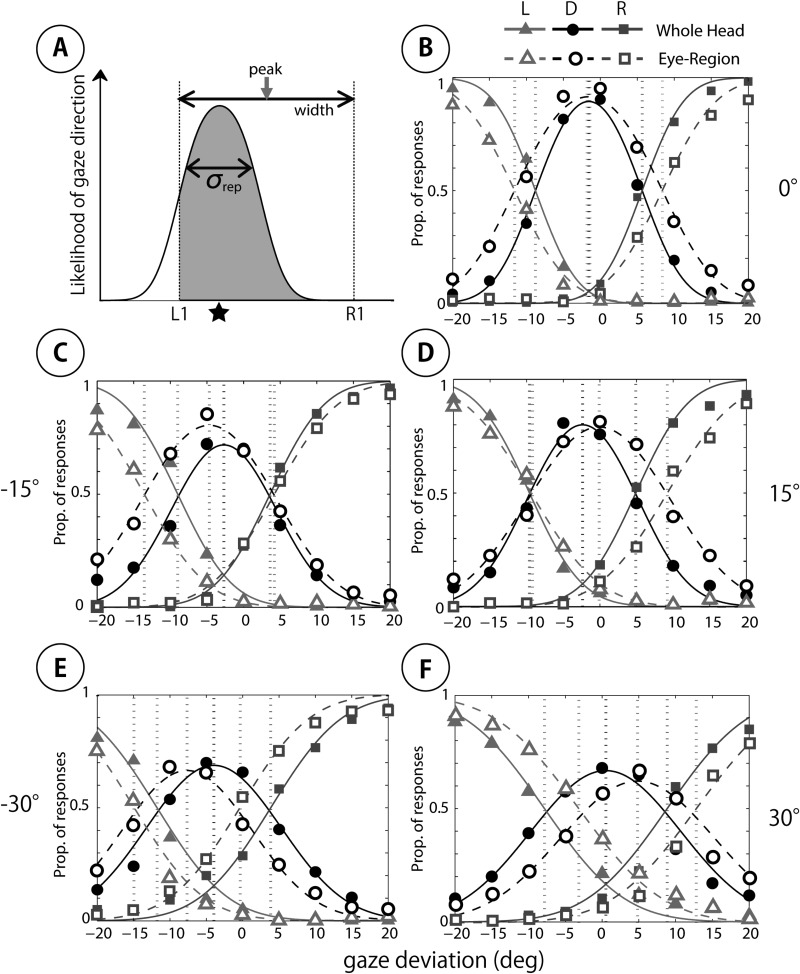
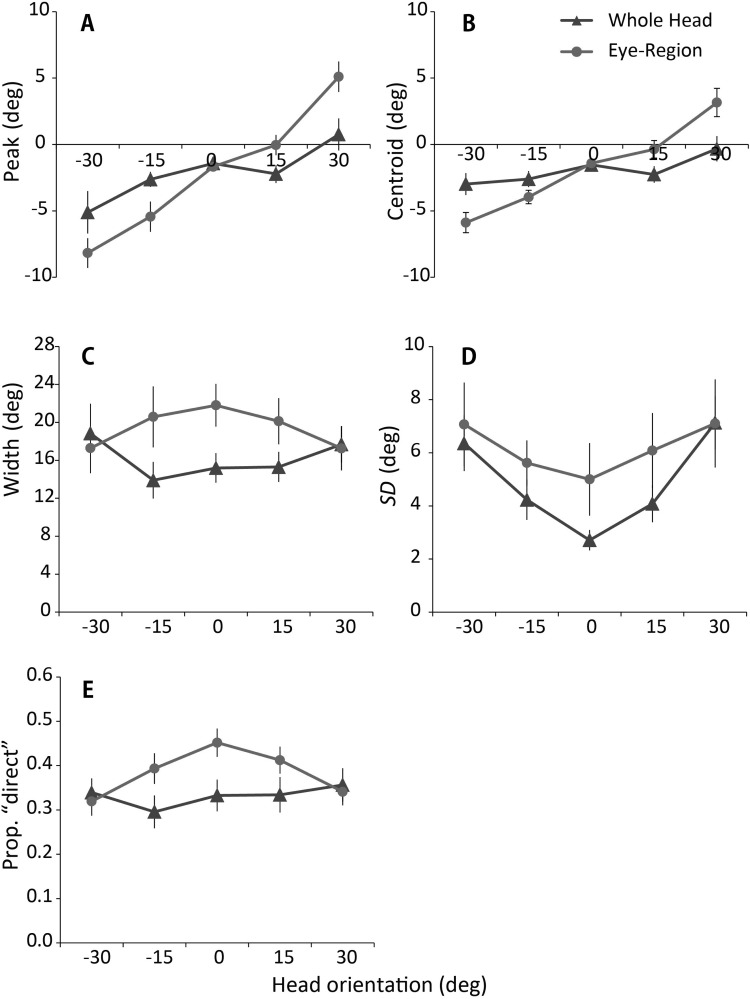
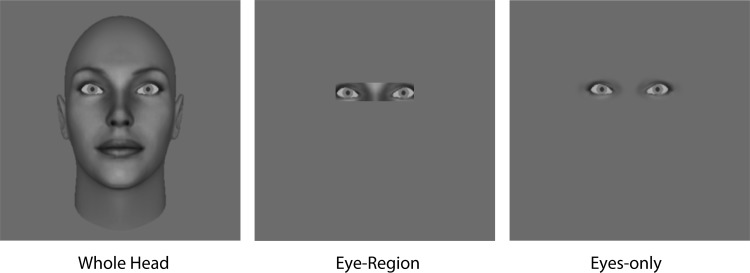
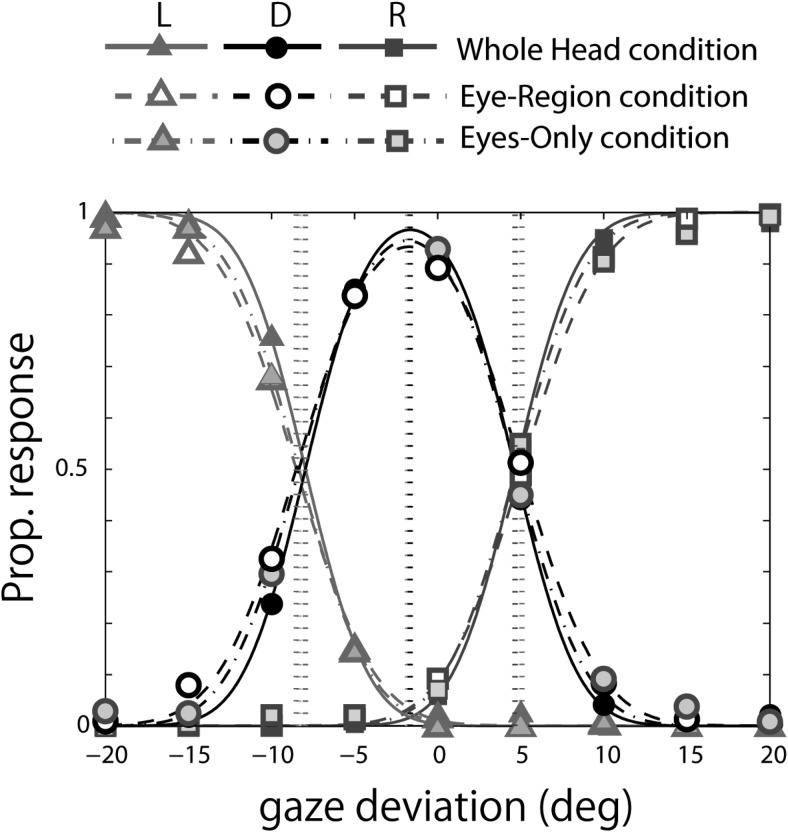
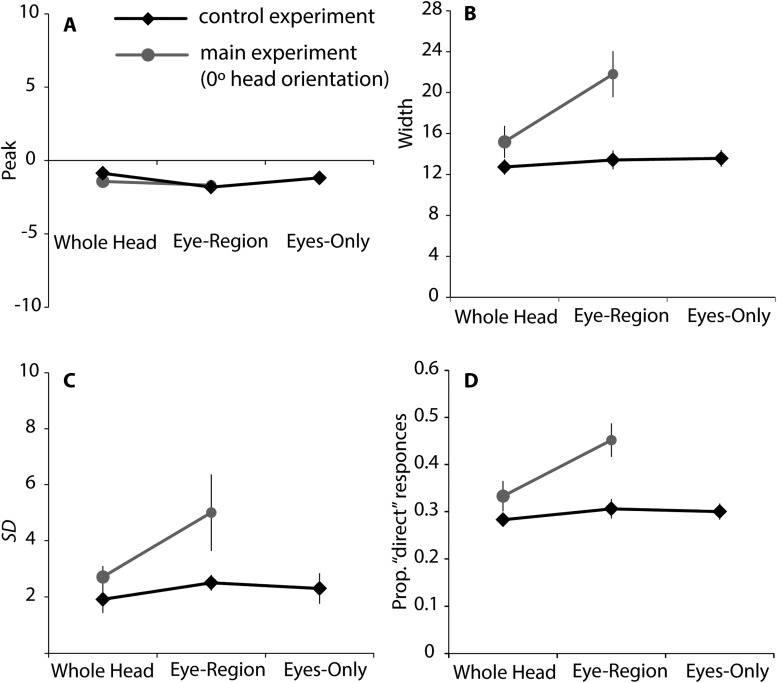
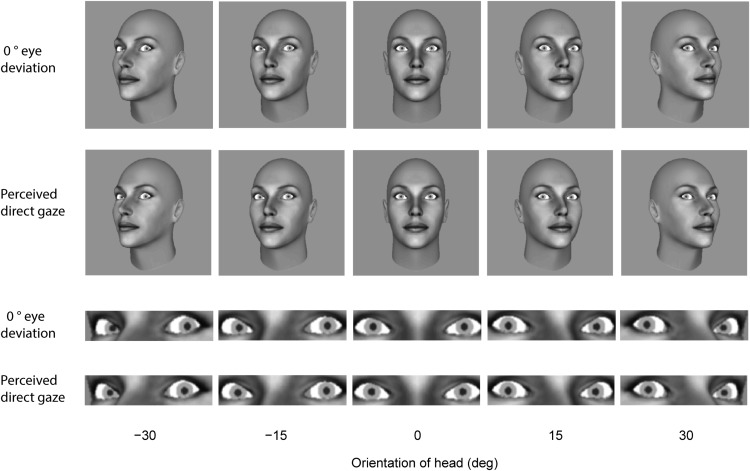
Previous studies on gaze perception have identified 2 opposing effects of head orientation on perceived gaze direction-1 repulsive and the other attractive. However, the relationship between these 2 effects has remained unclear. By using a gaze categorization task, the current study examined the effect of head orientation on the perceived direction of gaze in a whole-head condition and an eye-region condition. We found that the perceived direction of gaze was generally biased in the opposite direction to head orientation (a repulsive effect). Importantly, the magnitude of the repulsive effect was more pronounced in the eye-region condition than in the whole-head condition. Based on these findings, we developed a dual-route model, which proposes that the 2 opposing effects of head orientation occur through 2 distinct routes. In the framework of this dual-route model, we explain and reconcile the findings from previous studies, and provide a functional account of attractive and repulsive effects and their interaction.


Figures

Figure 1
Figure 1
Demonstration by Wollaston (From “On the Apparent Direction of Eyes in a Portrait,” by W. H. Wollaston, 1824, Philosophical Transactions of the Royal Society of London, 114, p. 256. In the public domain). From the drawing of a face oriented leftward with direct gaze (left), Wollaston produced another face by inserting the same eyes into a drawing of the same individual with his head oriented to the right (right). Although these two faces share identical eyes, the latter appears to be looking to the right of the viewer.
Figure 2
Figure 2
Example stimuli from the whole-head display condition and the corresponding stimuli in the eye-region display condition (shown in thin stripes).
Figure 3
Figure 3
Data from the whole-head condition averaged across subjects. (A) Proportion of direct responses as a function of eye deviation for each head orientation. (B) Logistic fits to the data recoded as proportion of rightward response. (C) Points of subjectively direct gaze derived from the fitted data together with the linear regression slope across head orientation. The gray area represents bootstrapped 95% confidence intervals and the error bar represents the standard deviation between subjects. (D) Effective weights of eye deviation and head orientation on perceived gaze direction.
Figure 4
Figure 4
Data from the eye-region condition averaged across subjects. (A) Proportion of direct responses as a function of eye deviation for each head orientation. (B) Logistic fits to the data recoded as proportion of rightward response. (C) Points of subjectively direct gaze derived from the fitted data together with the linear regression slope across head orientation. The gray area represents bootstrapped 95% confidence intervals and the error bar represents the standard deviation between subjects. (D) Effective weights of eye deviation and head orientation on perceived gaze direction.
Figure 5
Figure 5
Dual-route model for the influence of head orientation on perceived gaze direction. The weights attached to each cue were derived by comparing the experimental results from the whole-head and eye-region conditions.
Figure 6
Figure 6
Box plot summarizing individual subjects’ (n = 20) overall weighting of head orientation in the whole-head and eye-region conditions, and the inferred weighting of head orientation as a direct cue in the whole-head condition. The box covers the interquartile range and the median is indicated by the mark within the box. The whiskers represent the most extreme data value within 1.5 times the interquartile range. Outlier values are depicted as +.
Figure 7
Figure 7
The psychophysical model of Mareschal et al. (2013b) and fit of the model to the categorization data averaged across subjects. (A) The psychophysical model showing an observer’s sensory representation of the gaze stimulus. The likelihood of the observer responding “direct” to the direction of gaze, indicated by the star, corresponds to the area of the gray region under the Gaussian. The likelihood of the observer responding “left” corresponds to the area of the white region, and the likelihood of responding “right” is effectively zero. The vertical dashed lines represent the categorical boundaries. The distance between the two represents the width of the cone of direct gaze. The middle point of the categorical boundaries is taken as the peak direction of perceptually direct gaze. The standard deviation of the likelihood function, σrep, represents the level of sensory noise affecting the observer’s judgments (B to F). Model fit to the averaged data across subjects from the whole-head condition (solid lines) and from the eye-region condition (dashed lines) for each head orientation. The orientation of the head is represented by the number to the side of each panel. L = “left” response; D = “direct” response; R = “right” response.
Figure 8
Figure 8
Measures of direct responding and fitted parameters from the model of Mareschal et al. (2013b). (A) Estimates of the midpoints (peaks) between the categorical boundaries obtained by fitting individual data to the psychophysical model of Mareschal et al. (B) The centroid of the direct responses. (C) The distances between the modeled categorical boundaries (widths). (D) The modeled standard deviations of the sensory noise. (E) The proportion of “direct” responses. Each value was computed individually, and averaged across subjects. Error bars represented ±1 standard error of the mean across subjects.
Figure 9
Figure 9
Example of stimulus images used in the control experiment. All images were in the frontal head orientation.
Figure 10
Figure 10
Fit of the model of Mareschal et al. (2013b) to control experiment data. The categorization data at 0° head orientation averaged across subjects fitted by the model. L = “left” response; D = “direct” response; R = “right” response.
Figure 11
Figure 11
Results from the control experiment together with the results from the main experiment at 0° head orientation. Estimates of peaks (A), widths (B), and standard deviations (C) in the whole-head and eye-region conditions based on the model by Mareschal et al. (2013b), and the proportion of “direct” responses (D). Averaged data across subjects are shown. Error bars represented ±1 standard error of the mean across subjects.
Figure 12
Figure 12
Illustration of 0° eye deviation (physically direct gaze) and the eye deviation corresponding to perceived direct gaze according to the weightings computed from the mean data across subjects for each head orientation in the whole-head and the eye-region display conditions.

References

    1. Anstis S. M., Mayhew J. W., & Morley T. (1969). Perception of where a face or television “portrait” is looking. The American Journal of Psychology, 82, 474–489. doi:10.2307/1420441 - DOI - PubMed
    1. Brainard D. H. (1997). The psychophysics toolbox. Spatial Vision, 10, 433–436. doi:10.1163/156856897X00357 - DOI - PubMed
    1. Campbell R., Lawrence K., Mandy W., Mitra C., Jeyakuma L., & Skuse D. (2006). Meanings in motion and faces: Developmental associations between the processing of intention from geometrical animations and gaze detection accuracy. Development and Psychopathology, 18, 99–118. doi:10.1017/S0954579406060068 - DOI - PubMed
    1. Carlin J. D., Calder A. J., Kriegeskorte N., Nili H., & Rowe J. B. (2011). A head view-invariant representation of gaze direction in anterior superior temporal sulcus. Current Biology, 21, 1817–1821. doi:10.1016/j.cub.2011.09.025 - DOI - PMC - PubMed
    1. Cline M. G. (1967). The perception of where a person is looking. The American Journal of Psychology, 80, 41–50. doi:10.2307/1420539 - DOI - PubMed

Publication types