Comparative Study
. 2014 Nov;84(6):980-8.
doi: 10.2319/080313-579.1. Epub 2014 Apr 15.

Effect of Lithothamnium sp and calcium supplements in strain- and infection-induced bone resorption

Affiliations
Comparative Study

Effect of Lithothamnium sp and calcium supplements in strain- and infection-induced bone resorption

Silvana Rodrigues de Albuquerque Taddei et al. Angle Orthod. 2014 Nov.

Abstract

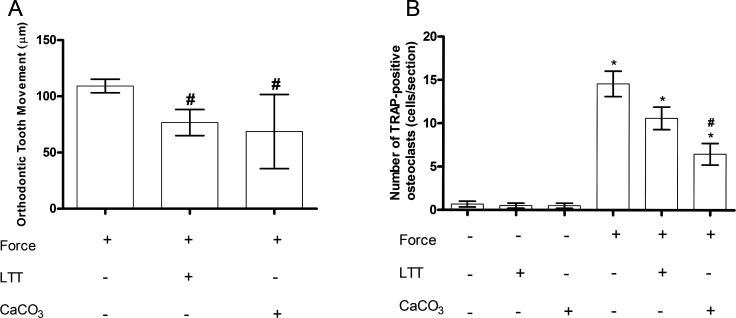
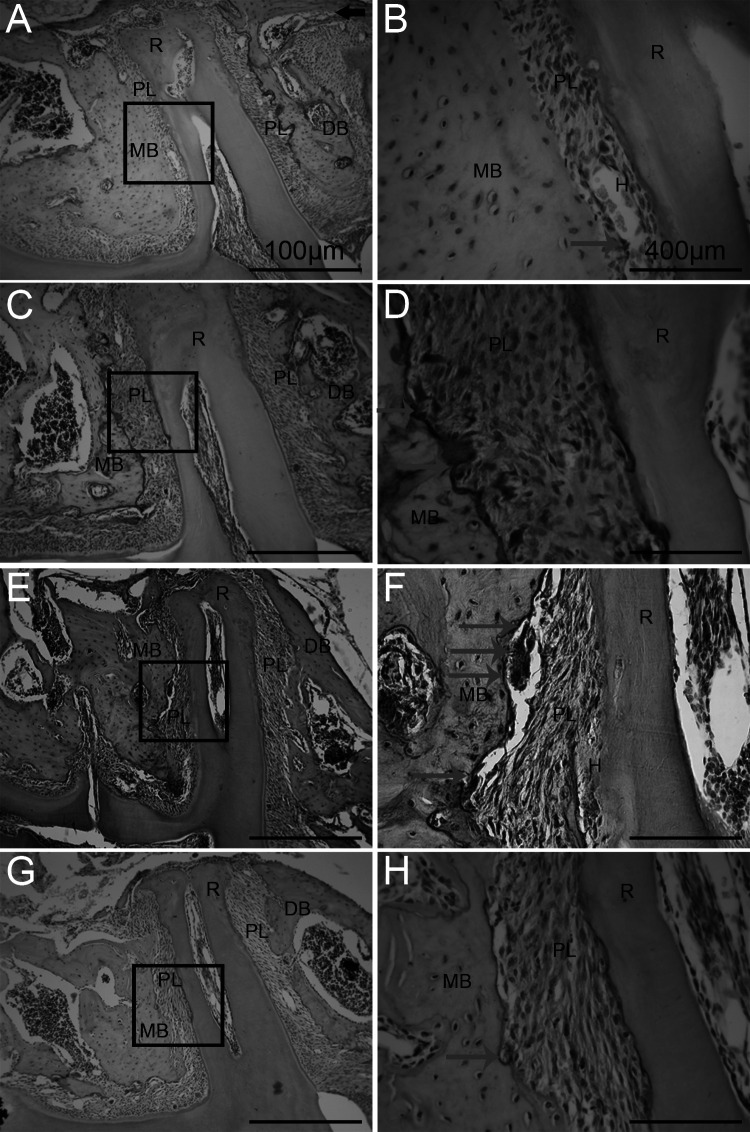
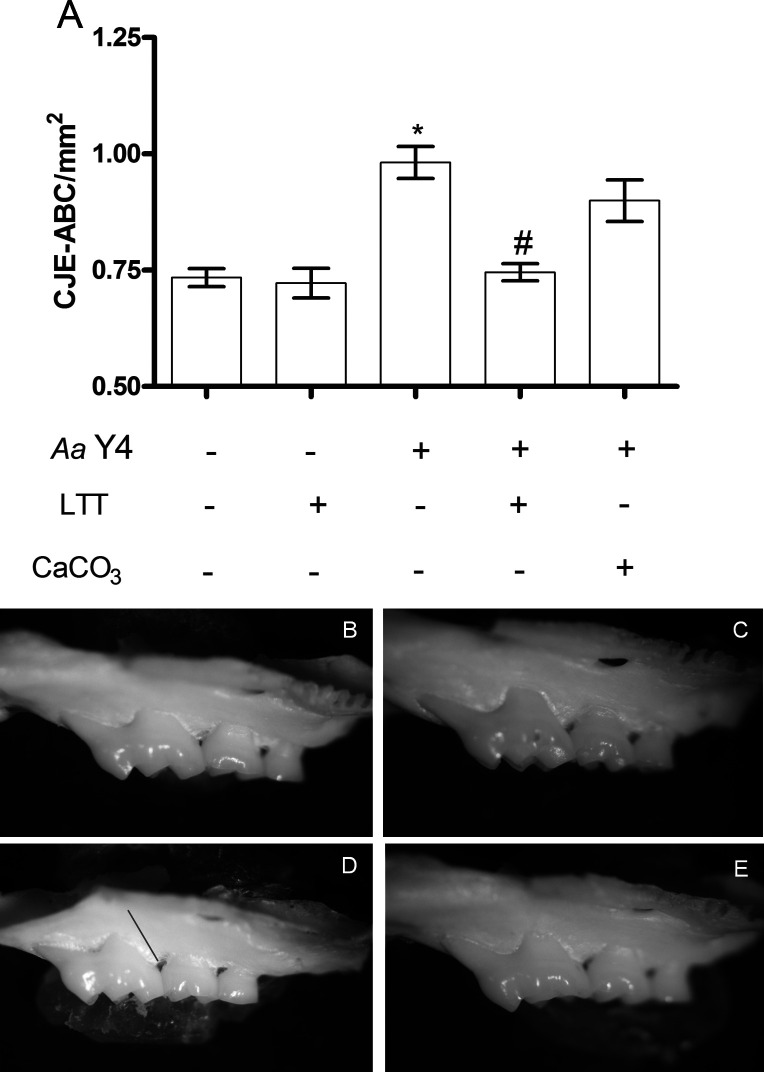
Objective: To investigate the effect of Lithothamnium sp (LTT) supplement, a calcium-rich alga widely used for mineral reposition, on strain-induced (orthodontic tooth movement [OTM]) and infection-induced bone resorption (periodontal disease [PD]) in mice.

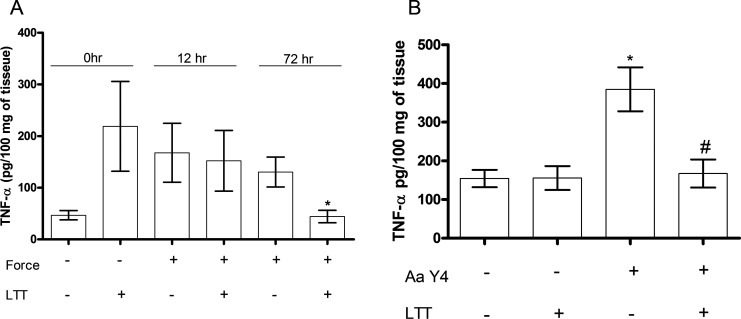
Materials and methods: Mice were divided into two bone resorption models: one with an orthodontic appliance and the other with PD induced by the oral inoculation of Aggregatibacter actinomycetencomitans (Aa). Both groups were fed a regular diet (vehicle), LTT-rich diet (LTT), or calcium-rich diet (CaCO3). Alveolar bone resorption (ABR), the number of osteoclasts, and the levels of tumor necrosis factor α (TNF-α), calcium, and vitamin D3 were evaluated.

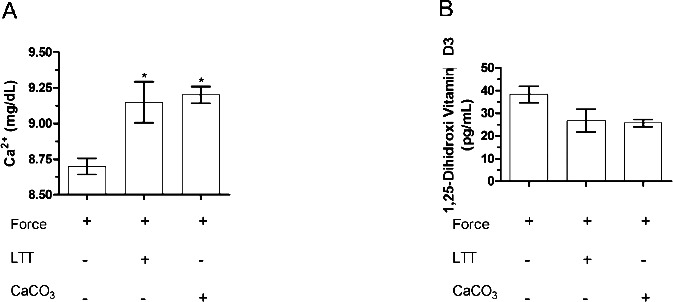
Results: The number of osteoclasts was reduced in LTT and CaCO3 mice, which led to diminished OTM and infection-induced alveolar bone loss. In addition, LTT- and calcium-treated groups also presented decreased levels of TNF-α in periodontal tissues and increased levels of calcium in serum.

Conclusions: These results indicate that the LTT supplement influences ABR, probably due to its calcium content, by affecting osteoclast function and local inflammatory response, thus modulating OTM and PD.

Keywords: Bone resorption; Calcium; Orthodontic tooth movement.


Figures

Figure 1. (A) Orthodontic tooth movement changes after 12 days. (B) Number of osteoclasts. *P < .05 when compared with control group (no force), one-way analysis of variance (ANOVA). #P < .05 when compared with vehicle-fed mice, one-way ANOVA. The values (means ± SEM) were obtained from five animals in two independent experiments.
Figure 1.
(A) Orthodontic tooth movement changes after 12 days. (B) Number of osteoclasts. *P < .05 when compared with control group (no force), one-way analysis of variance (ANOVA). #P < .05 when compared with vehicle-fed mice, one-way ANOVA. The values (means ± SEM) were obtained from five animals in two independent experiments.
Figure 2. Histological changes after 12 days of force. Close-up view in A (B), in C (D), in E (F), and in G (H). Small arrows indicate TRAP-positive osteoclasts. (A, B) Control group (no force). (C, D) Vehicle-fed, (E, F) LTT-fed, and (G, H) CaCO3-fed mice experimental groups (12 days after orthodontic force). DB indicates distal alveolar bone; LTT, Lithothamnium sp; MB, mesial alveolar bone; PL, periodontal ligament; R, root; TRAP, tartrate-resistant acid phosphatase. Arrow bar  =  100 µm.
Figure 2.
Histological changes after 12 days of force. Close-up view in A (B), in C (D), in E (F), and in G (H). Small arrows indicate TRAP-positive osteoclasts. (A, B) Control group (no force). (C, D) Vehicle-fed, (E, F) LTT-fed, and (G, H) CaCO3-fed mice experimental groups (12 days after orthodontic force). DB indicates distal alveolar bone; LTT, Lithothamnium sp; MB, mesial alveolar bone; PL, periodontal ligament; R, root; TRAP, tartrate-resistant acid phosphatase. Arrow bar  =  100 µm.
Figure 3. (A) Alveolar bone resorption (ABR) in the periodontal disease model during 60 days. Macroscopic evaluation of ABR in (B) mice without infection and infected mice (Y4) fed with (C) vehicle, (D) Lithothamnium sp (LTT), or (E) CaCO3. The arrow shows interdental ABR. *P < .05 when comparing the control group (noninfected mice), one-way analysis of variance (ANOVA). #P < .05 when compared with vehicle-fed mice, one-way ANOVA. The values (means ± SEM) were obtained from five animals in two independent experiments.
Figure 3.
(A) Alveolar bone resorption (ABR) in the periodontal disease model during 60 days. Macroscopic evaluation of ABR in (B) mice without infection and infected mice (Y4) fed with (C) vehicle, (D) Lithothamnium sp (LTT), or (E) CaCO3. The arrow shows interdental ABR. *P < .05 when comparing the control group (noninfected mice), one-way analysis of variance (ANOVA). #P < .05 when compared with vehicle-fed mice, one-way ANOVA. The values (means ± SEM) were obtained from five animals in two independent experiments.
Figure 4. (A) Expression of tumor necrosis factor α in the orthodontic tooth movement model after 0, 12, and 72 hours of mechanical loading, and (B) in the periodontal disease model after 30 days of infection (Y4). *P < .05 vs control group (no force or no infection), one-way analysis of variance (ANOVA). #P < .05 vs vehicle-fed group, one-way ANOVA. The values (means ± SEM) were obtained from five animals at each point in two independent experiments.
Figure 4.
(A) Expression of tumor necrosis factor α in the orthodontic tooth movement model after 0, 12, and 72 hours of mechanical loading, and (B) in the periodontal disease model after 30 days of infection (Y4). *P < .05 vs control group (no force or no infection), one-way analysis of variance (ANOVA). #P < .05 vs vehicle-fed group, one-way ANOVA. The values (means ± SEM) were obtained from five animals at each point in two independent experiments.
Figure 5. (A) Amount of calcium and (B) 1.25 dihydroxy vitamin D3 serum levels. *P < .05 when compared with the control group (no force), one-way analysis of variance (ANOVA). #P < .05 vs vehicle-fed mice, one-way ANOVA. The values (means ± SEM) were obtained from five animals in two independent experiments.
Figure 5.
(A) Amount of calcium and (B) 1.25 dihydroxy vitamin D3 serum levels. *P < .05 when compared with the control group (no force), one-way analysis of variance (ANOVA). #P < .05 vs vehicle-fed mice, one-way ANOVA. The values (means ± SEM) were obtained from five animals in two independent experiments.

Similar articles

Cited by

References

    1. Taddei SRA, Andrade I, Jr, Queiroz-Junior CM, Garlet GP, Garlet TP, Cunha FQ, Teixeira MM. The role of CCR2 in orthodontic tooth movement. Am J Orthod Dentofacial Orthop. 2012;141:153–160. - PubMed
    1. Garlet GP, Cardoso CR, Silva TA, et al. Cytokine pattern determines the progression of experimental periodontal disease induced by Actinobacillus actinomycetemcomitans through the modulation of MMPs, RANKL, and their physiological inhibitors. Oral Microbiol Immunol. 2006;21:12–20. - PubMed
    1. Matkovic V. Calcium metabolism and calcium requirements during skeletal modeling and consolidation of bone mass. Am J Clin Nutr. 1991;54(1 suppl):245S–260S. - PubMed
    1. Qin M, Zhang Z, Maki K, Naito M, Morimoto A, Kimura M. The effect of calcium supplement given with a mixture of calcium carbonate and calcium citrate on the mandibular alveolar bone of pubertal rats. J Bone Miner Metab. 1998;16:88–95.
    1. Lanou AJ, Berkow SE, Barnard ND. Calcium, dairy products, and bone health in children and young adults: a reevaluation of the evidence. Pediatrics. 2005;115:736–743. - PubMed

Publication types

MeSH terms