

National patterns of Escherichia coli O157 infections, USA, 1996-2011
- PMID: 24731294
- PMCID: PMC6542353
- DOI: 10.1017/S0950268814000880
National patterns of Escherichia coli O157 infections, USA, 1996-2011
Abstract
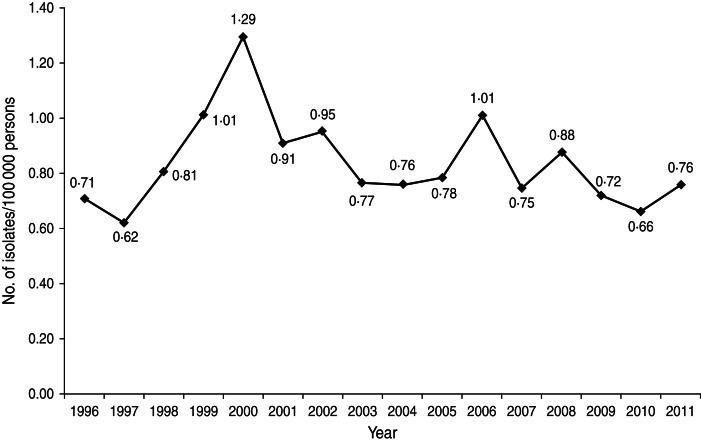
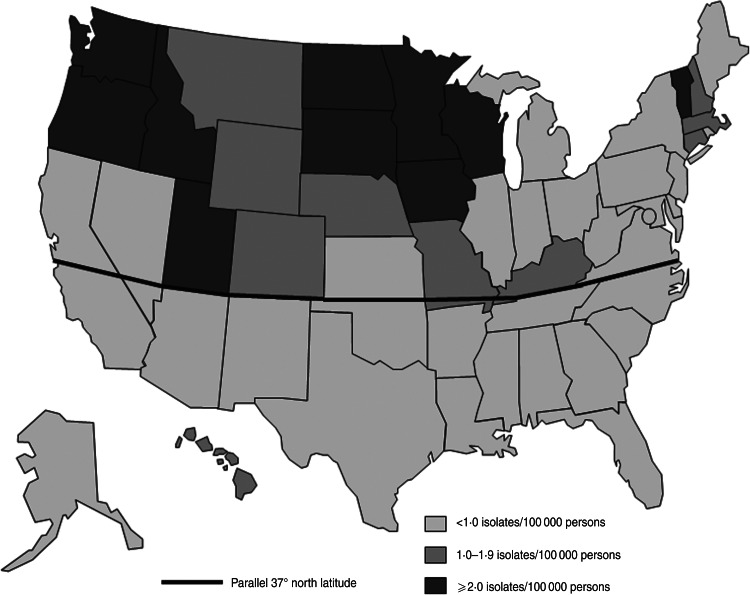
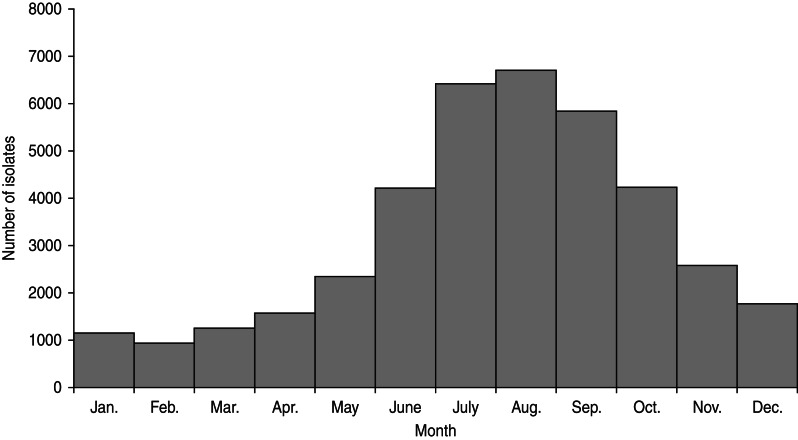
US public health laboratories began reporting Escherichia coli O157 isolates to CDC in 1996. We describe temporal and geographical patterns of isolates reported from 1996 to 2011 and demographics of persons whose specimens yielded isolates. We calculated annual E. coli O157 isolation rates/100 000 persons by patient's state of residence, county of residence, age, and sex using census data. The average annual isolation rate was 0·84. The average isolation rate in northern states (1·52) was higher than in southern states (0·43). Counties with ⩾76% rural population had a lower isolation rate (0·67) than counties with ⩽25%, 26-50%, and 51-75% rural populations (0·81, 0·92, and 0·81, respectively). The highest isolation rate (3·19) was in children aged 1-4 years. Infections were seasonal with 49% of isolates collected during July to September. Research into reasons for higher incidence in northern states and for seasonality could guide strategies to prevent illnesses.
Conflict of interest statement
None.
Figures
References
-
- Slutsker L, et al. Escherichia coli O157:H7 diarrhea in the United States: clinical and epidemiologic features. Annals of Internal Medicine 1997; 126: 505–513. - PubMed
-
- Hilbe J. Negative Binomial Regression, 2nd edn. New York: Cambridge University Press, 2011.
-
- US Census 2010. (http://www.census.gov/2010census/data/).
-
- Boyce TG, Swerdlow DL, Griffin PM. Escherichia coli O157:H7 and the hemolytic-uremic syndrome. New England Journal of Medicine 1995; 333: 364–368. - PubMed
MeSH terms
Grants and funding
LinkOut - more resources
Full Text Sources
Other Literature Sources
Medical
