. 2014 May;6(5):1046-68.
doi: 10.1093/gbe/evu079.

Comparative genomic analysis and virulence differences in closely related salmonella enterica serotype heidelberg isolates from humans, retail meats, and animals

Affiliations

Comparative genomic analysis and virulence differences in closely related salmonella enterica serotype heidelberg isolates from humans, retail meats, and animals

Maria Hoffmann et al. Genome Biol Evol. 2014 May.

Abstract

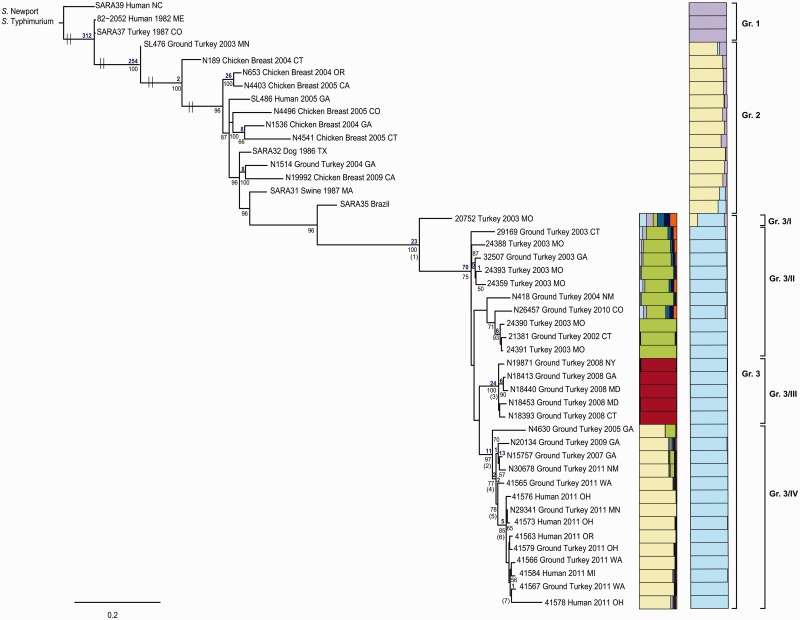
Salmonella enterica subsp. enterica serovar Heidelberg (S. Heidelberg) is one of the top serovars causing human salmonellosis. Recently, an antibiotic-resistant strain of this serovar was implicated in a large 2011 multistate outbreak resulting from consumption of contaminated ground turkey that involved 136 confirmed cases, with one death. In this study, we assessed the evolutionary diversity of 44 S. Heidelberg isolates using whole-genome sequencing (WGS) generated by the 454 GS FLX (Roche) platform. The isolates, including 30 with nearly indistinguishable (one band difference) Xbal pulsed-field gel electrophoresis patterns (JF6X01.0032, JF6X01.0058), were collected from various sources between 1982 and 2011 and included nine isolates associated with the 2011 outbreak. Additionally, we determined the complete sequence for the chromosome and three plasmids from a clinical isolate associated with the 2011 outbreak using the Pacific Biosciences (PacBio) system. Using single-nucleotide polymorphism (SNP) analyses, we were able to distinguish highly clonal isolates, including strains isolated at different times in the same year. The isolates from the recent 2011 outbreak clustered together with a mean SNP variation of only 17 SNPs. The S. Heidelberg isolates carried a variety of phages, such as prophage P22, P4, lambda-like prophage Gifsy-2, and the P2-like phage which carries the sopE1 gene, virulence genes including 62 pathogenicity, and 13 fimbrial markers and resistance plasmids of the incompatibility (Inc)I1, IncA/C, and IncHI2 groups. Twenty-one strains contained an IncX plasmid carrying a type IV secretion system. On the basis of the recent and historical isolates used in this study, our results demonstrated that, in addition to providing detailed genetic information for the isolates, WGS can identify SNP targets that can be utilized for differentiating highly clonal S. Heidelberg isolates.

Keywords: SNP analysis; antimicrobial resistance; outbreak; plasmid; trace-back.


Figures

F<sc>ig</sc>. 1.—
Fig. 1.—
The number of assembled bases (Mb) and N50 contig size (kb) for each sequenced S. Heidelberg isolate. Samples are colored according to the presence of antimicrobial resistance plasmids. No antimicrobial resistance plasmid, filled triangles; antimicrobial resistance Inc-I plasmid, filled diamonds; antimicrobial resistance Inc-H1/2 plasmid, filled circles; antimicrobial resistance plasmid Inc-I and H1/2, filled circles with borders; antimicrobial resistance plasmid Inc-AC, filled squares; antimicrobial resistance plasmid IncI and Inc-AC, filled squares with borders.
F<sc>ig</sc>. 2.—
Fig. 2.—
ML tree based on SNP analysis of 44 S. Heidelberg isolates and previously reported S. Heidelberg genome sequences SL476 (12). A total of 40,716 variable SNPs with 12,187 being informative were found using GS Reference Mapper followed by a custom pipeline. The ML tree was generated in GARLI v.2.0 (Zwickl 2006a) under the GTR+Γ model of nucleotide evolution and visualized using Figtree v1.3.1. Parameter space was searched for the best tree with simultaneous estimation for model parameters using a ML search. The best tree was identified from 100 runs on the nonbootstrapped data set. Measures of clade confidence are reported below each node in the form of bootstrap values (1,000 iterations). Bootstrap values <70% were not shown. The tree was rooted using S. Newport 637564 and S. Typhimurium AZ057. The taxa of source for each isolate, geographic location, and date were mapped onto the tree. Prophage observations are further depicted on the tree using colored bars, shown on the right.
F<sc>ig</sc>. 3.—
Fig. 3.—
ML tree based for the 44 S. Heidelberg isolates and two previously reported S. Heidelberg genome sequences SL476 and SL486 (Fricke et al. 2011). A total of 4,053 SNPs with 1,394 being informative were found based on k-mer analysis using kSNP. ML trees were generated as described in figure 2. Bootstrap values (1,000 iterations) are reported below each node. The numbers of unambiguous substitutions that mapped to the tree only once and are greater than zero are given above each node in blue. The numbers in parenthesis represent the nodes in table 3. To the right of the tree, two Distruct plots were reconstructed with the same SNP matrix—one including all 46 S. Heidelberg isolates and, adjacent to that, another with only those isolates from group 3—to present a fine-scale structure is shown. The Distruct plot was generated using a model-based Bayesian clustering method implemented in Structure v2.3.2 and visualized with DISTRUCT v1.1. 10 replicate analysis at K = 2–9 under the admixture model with correlated allele frequencies were performed. Each independent run consisted of 50,000 generations serving as burnin followed by 100,000 generations. Different colors represent the different clusters and each bar represents an individual isolate. The fraction of the bar that is a given color represents the coefficient of membership to that cluster (e.g., multicolored bars indicate membership to multiple groups indicative of admixture).
F<sc>ig</sc>. 4.—
Fig. 4.—
(A) Histogram showing the number of SNPs per core genes. (B) Histogram showing haplotype diversity for all variable, core genes.
F<sc>ig</sc>. 5.—
Fig. 5.—
Chromosome and plasmids features of a clinical S. Heidelberg isolate 41578. The circular map was drawn using dnaplotter. Different features are shown in different colored bars. (A) Chromosome: The coding sequence are shown in dark blue, rRNA is shown in green, tRNA is shown in yellow, prophages are shown in blue, and Salmonella pathogenicity islands are shown in red. Track 7 represents the GC content while Track 8 shows the GC skew [(G − C)/G + C]. (B) IncI1 antimicrobial resistance plasmid: The coding sequences are shown in dark blue and resistance genes are shown in red. Track 5 shows the GC skew [(G − C)/G + C]. Regions of GC content above average of the plasmid are drawn outside the ring in yellow, whereas regions below average are inside the ring in purple. (C) VirB/D4 virulence plasmid: The coding sequences are shown in dark blue, genes that carry the T4SS are shown in red, genes responsible for plasmid stability, and replication is shown in green. Track 6 shows the GC skew [(G − C)/G + C]. Regions of GC content above average of the plasmid are drawn outside the ring in yellow, whereas regions below average are inside the ring in purple.
F<sc>ig</sc>. 6.—
Fig. 6.—
ML tree based for the 22 identified VB/D4 plasmids, including the reference S. Heidelberg plasmid pSARA30. A total of 338 SNPs with all being informative, were found based on k-mer analysis using kSNP. The numbers of unambiguous substitutions that mapped to the tree only once are given above each node. ML trees were generated as described in figure 3. Bootstrap values (1,000 iterations) are reported below each node.
F<sc>ig</sc>. 7.—
Fig. 7.—
Caenorhabditis elegans survival data from six S. Heidelberg isolates. The figure shows that the six S. Heidelberg isolates (29169, SARA 31, 418, 41565, 41578, and N30678) are significantly (P < 0.0001) more pathogenic than the Escherichia coli OP 50 control strain. Further the figures show that isolates not carrying any T4SS components tend to be significant less pathogenic than those isolates that do carry them.
F<sc>ig</sc>. 8.—
Fig. 8.—
Absence and presence tree of resistance genes among S. Heidelberg isolates associated with paraphyletic group 3. It is a similarity tree based on binary distances under neighbor-joining algorithm for tree construction. The resistance genes and incompatibility group of the resistance plasmid are mapped to the tree.

References

    1. Aballay A, Yorgey P, Ausubel FM. Salmonella typhimurium proliferates and establishes a persistent infection in the intestine of Caenorhabditis elegans. Curr Biol. 2000;10:1539–1542. - PubMed
    1. Allard MW, et al. High resolution clustering of Salmonella enterica serovar Montevideo strains using a next-generation sequencing approach. BMC Genomics. 2012;13:32. - PMC - PubMed
    1. Allard MW, et al. On the evolutionary history, population genetics and diversity among isolates of Salmonella enteritidis PFGE pattern JEGX01.0004. PLoS One. 2013;8:e55254. - PMC - PubMed
    1. Alvarez-Martinez CE, Christie PJ. Biological diversity of prokaryotic type IV secretion systems. Microbiol Mol Biol Rev. 2009;73:775–808. - PMC - PubMed
    1. Aziz RK, et al. The RAST Server: rapid annotations using subsystems technology. BMC Genomics. 2008;9:75. - PMC - PubMed

Publication types

MeSH terms

LinkOut - more resources