. 2014 Aug;24(8):1271-84.
doi: 10.1101/gr.168781.113. Epub 2014 Apr 14.

Vascular histone deacetylation by pharmacological HDAC inhibition

Affiliations

Vascular histone deacetylation by pharmacological HDAC inhibition

Haloom Rafehi et al. Genome Res. 2014 Aug.

Abstract

HDAC inhibitors can regulate gene expression by post-translational modification of histone as well as nonhistone proteins. Often studied at single loci, increased histone acetylation is the paradigmatic mechanism of action. However, little is known of the extent of genome-wide changes in cells stimulated by the hydroxamic acids, TSA and SAHA. In this article, we map vascular chromatin modifications including histone H3 acetylation of lysine 9 and 14 (H3K9/14ac) using chromatin immunoprecipitation (ChIP) coupled with massive parallel sequencing (ChIP-seq). Since acetylation-mediated gene expression is often associated with modification of other lysine residues, we also examined H3K4me3 and H3K9me3 as well as changes in CpG methylation (CpG-seq). RNA sequencing indicates the differential expression of ∼30% of genes, with almost equal numbers being up- and down-regulated. We observed broad deacetylation and gene expression changes conferred by TSA and SAHA mediated by the loss of EP300/CREBBP binding at multiple gene promoters. This study provides an important framework for HDAC inhibitor function in vascular biology and a comprehensive description of genome-wide deacetylation by pharmacological HDAC inhibition.


Figures

Figure 1.
Figure 1.
Biological effects of TSA in primary human vascular endothelial cells. (A) Genome-wide distribution of chromatin marks shows significant H3K9/14 acetylation and deacetylation by HDAC inhibition. The plots shown compare the number of tags (the log2 of the read abundance, i.e., logConcentration determined by edgeR) versus the log2 fold change (log2FC). Regions subject to significant changes are shown in red (adjusted P < 0.05), and nonsignificant changes are shown in black for TSA-stimulated HAECs. Distribution plots were divided into four quadrants for H3K9/14ac and H3K4me3. (B) The number of differential H3K9/14ac regions (adjusted P < 0.05). Determination of differential enrichment is described in the Methods. (C) The percentage of differential H3K9/14ac regions (adjusted P < 0.05) located within the gene promoter (2.5 kb either side of the TSS). Enrichment of H3K9/14ac by genomic feature (D) and mRNA/ncRNA (E) was determined using Fisher’s exact test. The log2 odds ratio for the genomic distribution of increased and decreased H3K9/14ac is represented. Error bars represent 95% confidence intervals.
Figure 2.
Figure 2.
DNA methylation is correlated with the action of TSA at gene promoters. Fisher’s exact test was used to correlate gene expression and H3K9/14ac with DNA methylation. DNA methylation regions with a concentration (log2 of the average number of reads in all samples per region, i.e., logConcentration determined by edgeR) of greater than −17 were classified as high levels of methylation (HCP), and regions below −17 were defined as low DNA methylation (LCP). Error bars represent 95% confidence intervals of the log2 of the odds ratio. (A) Changes in mRNA expression were defined as log2FC > 0 (increased gene expression) or log2FC < 0 (decreased gene expression), and adjusted P < 0.05. (B) Regions of acetylation were defined as log2FC > 1 (increased acetylation) or log2FC < −1 (decreased acetylation), adjusted P < 0.05. Only regions with preexisting histone acetylation (cutoff of 400 reads) were included in the analyses. Correlations between increased (C) and decreased (D) gene expression are shown for histone acetylation (yellow) and deacetylation (green). Genes were grouped (x-axis) according to the level of up- or down-regulation observed from the mRNA-seq analysis, as a cumulative rank (i.e., top 10 genes, top 20 genes, and so on, where the largest “all” category represents the whole gene set and “nc” represents no change, adjusted P < 0.05). The correlation is reported as the percentage of genes in each rank associated with changes in H3K9/14ac at the promoter.
Figure 3.
Figure 3.
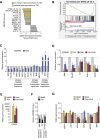
Loss of EP300/CREBBP HATs at gene promoters is associated with histone deacetylation. (A) GSEA identifies changes in transcription factor binding at deacetylated gene promoters using the ENCODE ChIP-seq collection of various transcription and coregulatory factors and chromatin-associated proteins (TFBS). A negative normalized enrichment score (NES) shows deacetylated gene sets, while a positive NES score indicates gene sets associated with histone acetylation. All gene sets are NOM P-value < 0.05 and FDR Q-value < 0.05 according to the standard GSEA output. Yellow bars indicate corresponding changes in gene expression of the DNA or chromatin-bound factors in TSA-stimulated HAECs (adjusted P < 0.05). Numbers following the protein name represent the cell line and have been defined in the Supplemental Methods. (B) GSEA plot showing an association of EP300-bound genes associated with histone deacetylation in response to TSA. Genes are ranked by changes in H3K9/14ac. (C) Gene expression changes of HAECs exposed to the C646 EP300/CREBBP inhibitor compared to DMSO control, determined by qRT-PCR. Genes are divided into three groups based on EP300/CREBBP-dependent regulation. The first group comprises expressed genes dependent on EP300/CREBBP; the second group is EP300/CREBBP-independent genes; and the third group is suppressed genes dependent on EP300/CREBBP. All data, n = 4, except for IL8 and IRS2, n = 3. (D,E) qRT-PCR was performed in TSA-stimulated HAECs (500 nM, 12 h), C646 (20 μM, 15 h), and a combination of both C646 and TSA (C646: 20 μM, 15 h; TSA: 500 nM, 12 h). All changes in expression (TSA, C646, TSA + C646) are relative to the DMSO control. Gene expression was determined by normalizing against HPRT1. TSA-stimulated changes in gene expression are shown for genes with promoters associated with decreased (D) and increased (E) histone acetylation. (F) ChIP analysis was performed using anti-CREBBP antibody in TSA-stimulated HAECs (TSA: 500 nM for 12 h). (G) TSA-dependent changes in gene expression regulated by the C646 EP300/CREBBP inhibitor. Error bars represent SEM. For DMSO-, TSA-, and C646-treated cells, n = 4. For TSA + C646 treated cells, n = 3. For CREBBP ChIP, n = 3. (*) P < 0.05, (**) P < 0.005, (***) P < 0.0005, (****) P < 0.0001, (#) P < 0.06, unpaired t-test.
Figure 4.
Figure 4.
Genome-wide deacetylation using HDAC inhibitors. (A) Heat map showing gene expression (adjusted P < 0.05) and corresponding histone acetylation changes. HAECs were stimulated with 500 nM TSA for 12 h, and the corresponding changes in H3K9/14ac (ChIP-seq) at the promoter region were intersected with gene expression (mRNA-seq). (Red) Increases in gene expression and histone acetylation; (blue) corresponding decreases. (B) Heat map of changes in gene expression, based on Pol II ChIP-seq, in CD4+ T-cells stimulated with 100 ng/mL TSA and 2 mM sodium butyrate for 2 h, and corresponding changes in H3K9ac (at 2 and 8 h). Data derived from GEO (Series ID: GSE15735). (C) Normalized enrichment scores derived from GSEA showing the association of HATs in native CD4+ T-cells (determined by ChIP-seq) and changes in acetylation following 8 h stimulation with 100 ng/mL TSA and 2 mM sodium butyrate. (D) Heat map showing changes in gene expression (adjusted P < 0.05) in SAHA-stimulated HAECs (2 μM, 12 h) and corresponding changes in H3K9/14ac at gene promoters. (E,F) Gene expression changes are associated with H3K9/14ac modification in SAHA-stimulated HAECs. Genes were ranked based on expression derived from mRNA-seq analysis. (For example, the top “10” genes are shown followed by the top “20” genes and so on [adjusted P < 0.05].) The largest category represents “all” genes and “nc” refers to no change in gene expression.
Figure 5.
Figure 5.
HDAC inhibition by SAHA and TSA. H3K9/14ac at promoters of genes implicated in vascular endothelial function in response to TSA and SAHA stimulation are shown. (A) Increased STC1 gene expression was associated with promoter acetylation. (B) Reduced CCL2 gene expression was not associated with changes in histone acetylation. Reduced IL6 (C) and BMX (D) gene expression were associated with histone deacetylation. H3K9/14ac profiles shown are representative of three independent experiments. Kernel density estimation bandwidth: 200.
Figure 6.
Figure 6.
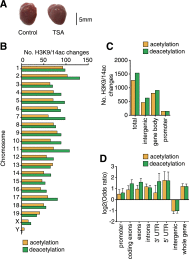
HDAC inhibition confers H3K9/14 acetylation and deacetylation in the heart. C57BL/6 male mice were injected subcutaneously with TSA twice daily over a 4-wk period. (A) Image of hearts from control and TSA-injected mice. (B) Ideogram of differential H3K9/14ac regions for mouse (mm9) genome. (C) H3K9/14ac changes in mouse left ventricle calculated and shown as the total number of histone acetylation and deacetylation sites at intergenic regions, gene body, and promoter regions. (D) Distribution of H3K9/14 acetylation and deacetylation shown by genomic feature using Fisher’s exact test, represented as the log2 odds ratio. Error bars represent 95% confidence intervals. Feature annotation is described in the Methods.

References

    1. Albaugh BN, Arnold KM, Lee S, Denu JM. 2011. Autoacetylation of the histone acetyltransferase Rtt109. J Biol Chem 286: 24694–24701 - PMC - PubMed
    1. Almeida AM, Murakami Y, Baker A, Maeda Y, Roberts IA, Kinoshita T, Layton DM, Karadimitris A. 2007. Targeted therapy for inherited GPI deficiency. N Engl J Med 356: 1641–1647 - PubMed
    1. Benjamini Y, Hochberg Y. 1995. Controlling the false discovery rate: a practical and powerful approach to multiple testing. J R Stat Soc Ser B Methodol 57: 289–300
    1. Blanchette M, Bataille AR, Chen X, Poitras C, Laganiere J, Lefebvre C, Deblois G, Giguere V, Ferretti V, Bergeron D, et al. . 2006. Genome-wide computational prediction of transcriptional regulatory modules reveals new insights into human gene expression. Genome Res 16: 656–668 - PMC - PubMed
    1. Blanco-Garcia N, Asensio-Juan E, de la Cruz X, Martinez-Balbas MA. 2009. Autoacetylation regulates P/CAF nuclear localization. J Biol Chem 284: 1343–1352 - PubMed

Publication types

MeSH terms