. 2014 Jul;34(13):2382-95.
doi: 10.1128/MCB.01602-13. Epub 2014 Apr 14.

Mechanism of action of phenethylisothiocyanate and other reactive oxygen species-inducing anticancer agents

Affiliations

Mechanism of action of phenethylisothiocyanate and other reactive oxygen species-inducing anticancer agents

Indira Jutooru et al. Mol Cell Biol. 2014 Jul.

Abstract

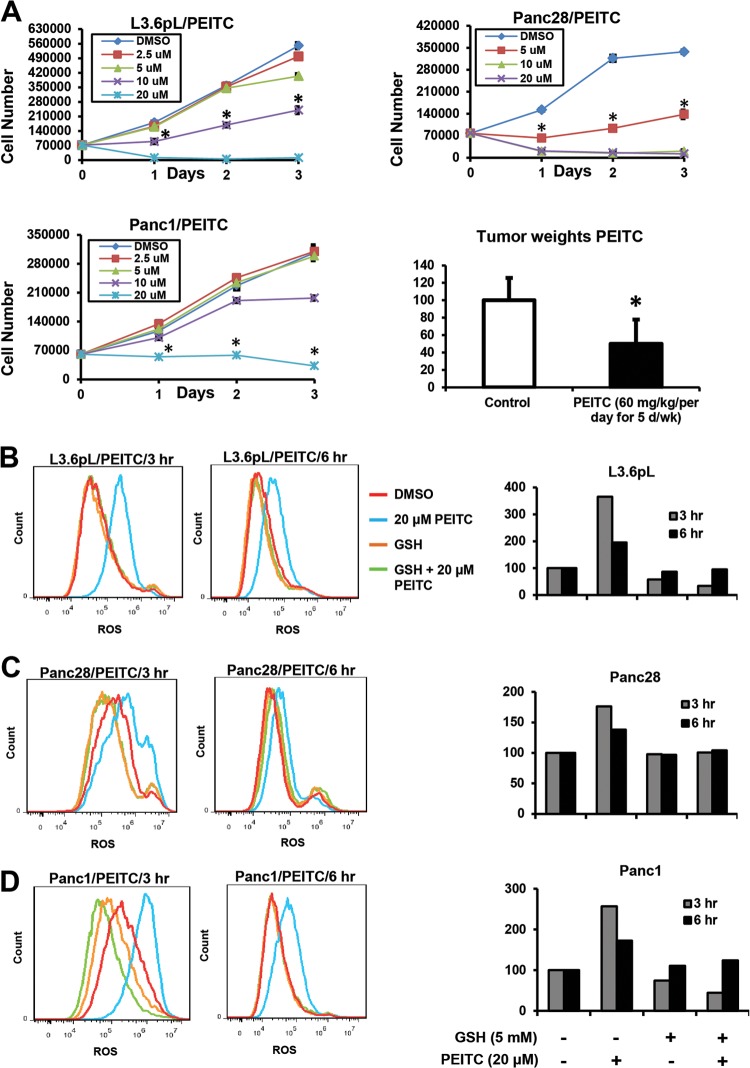
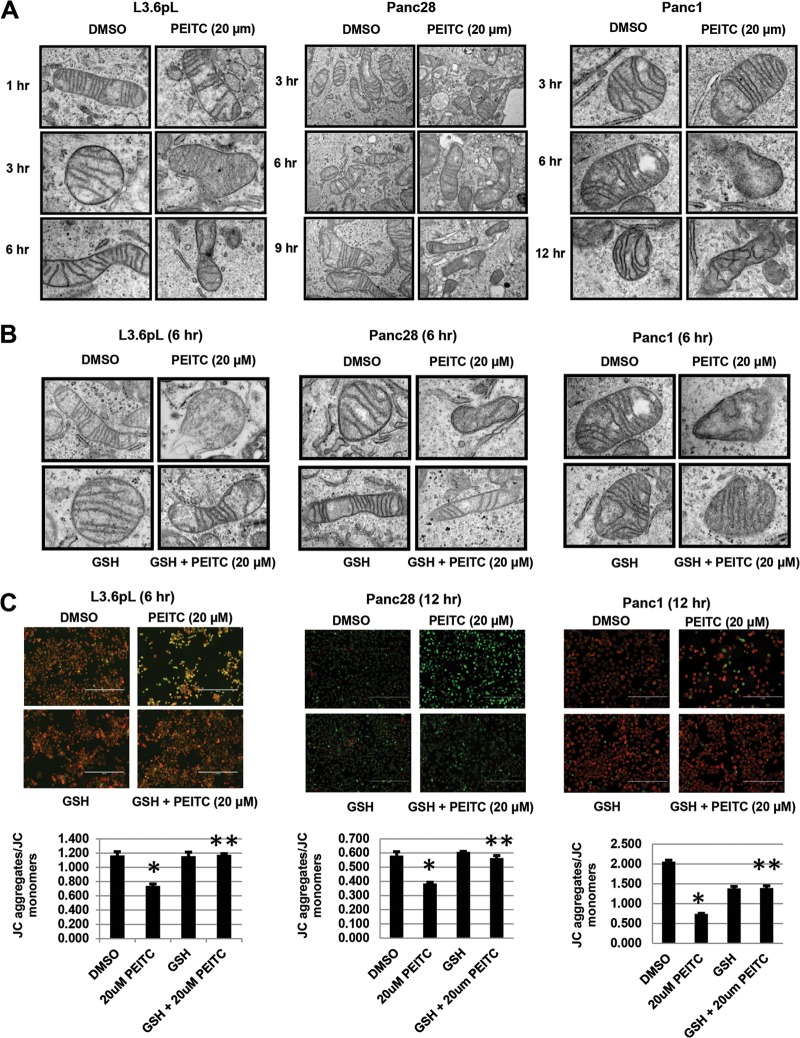
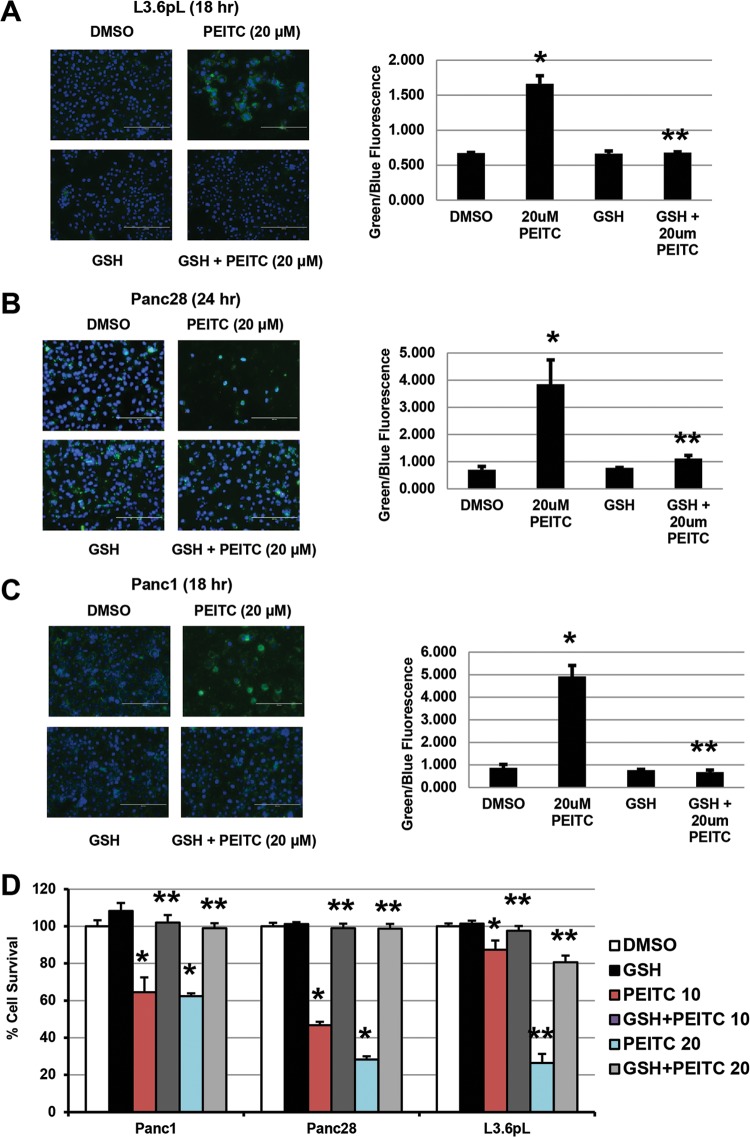
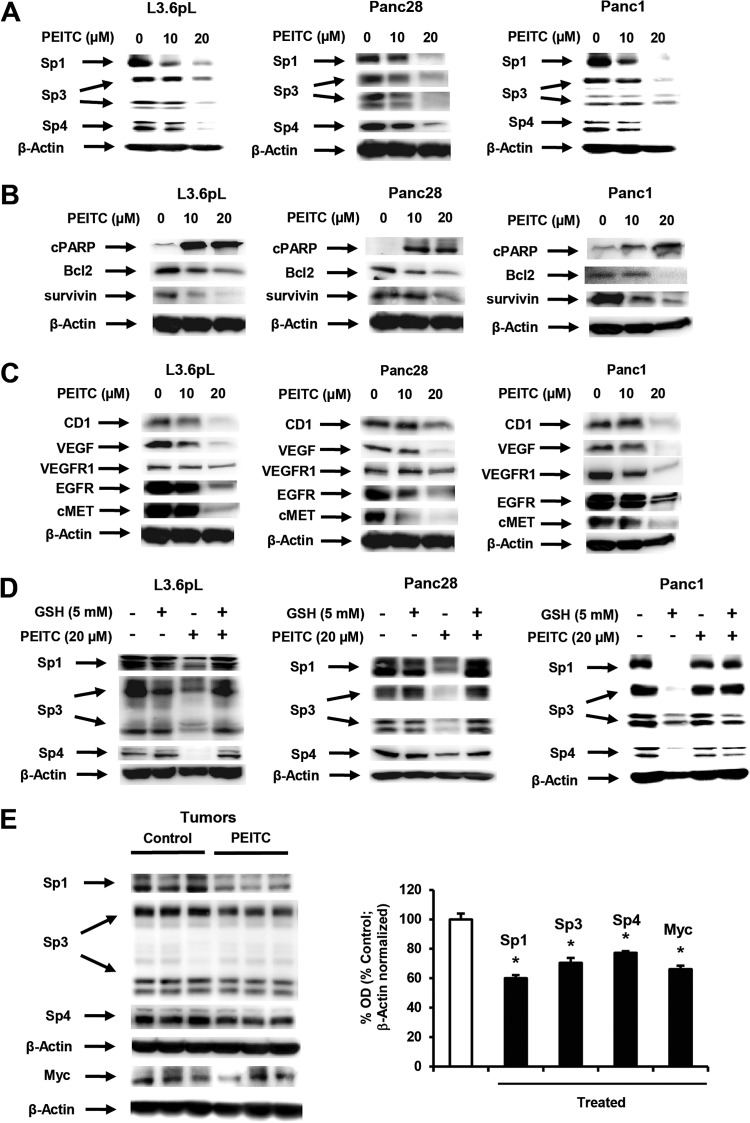
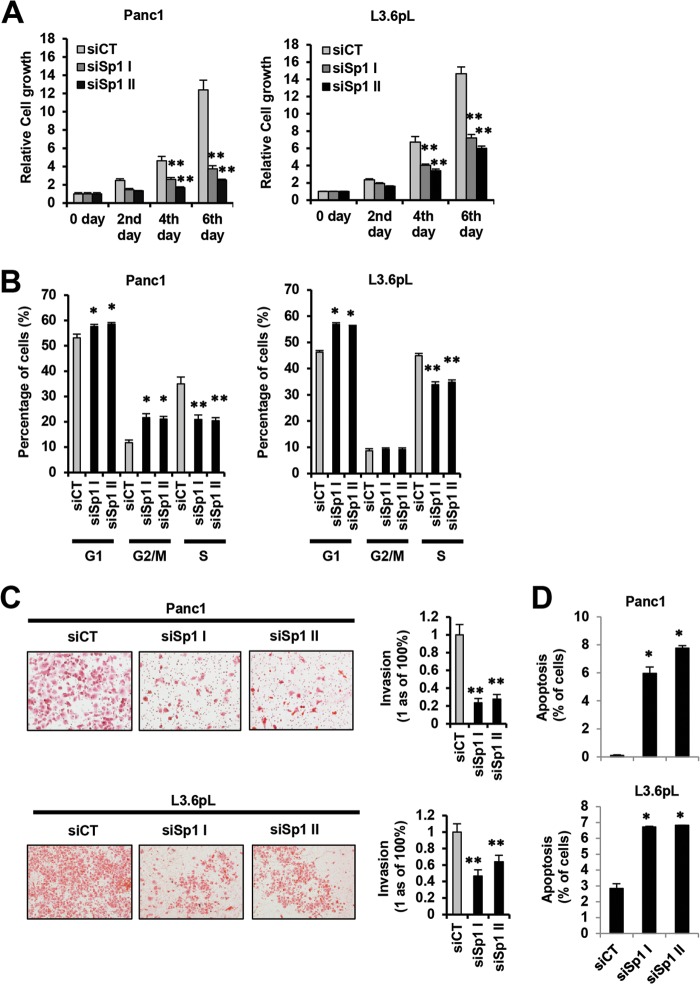
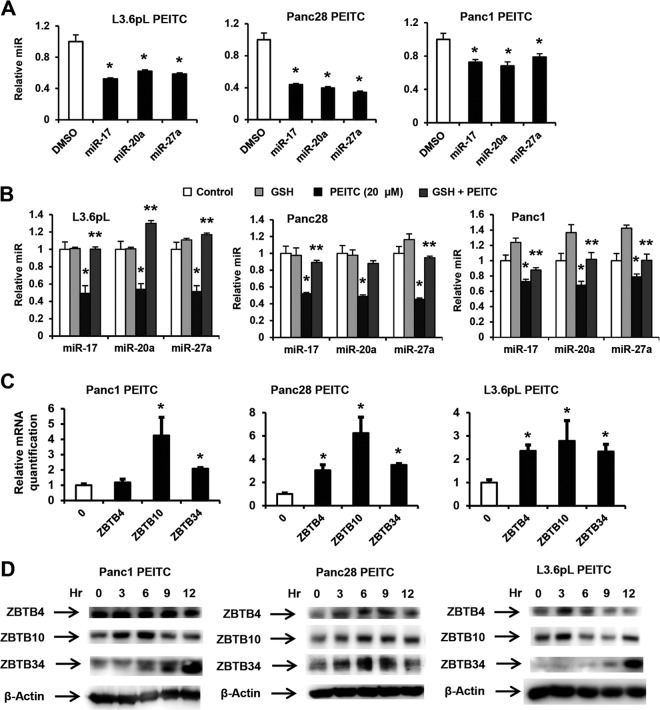
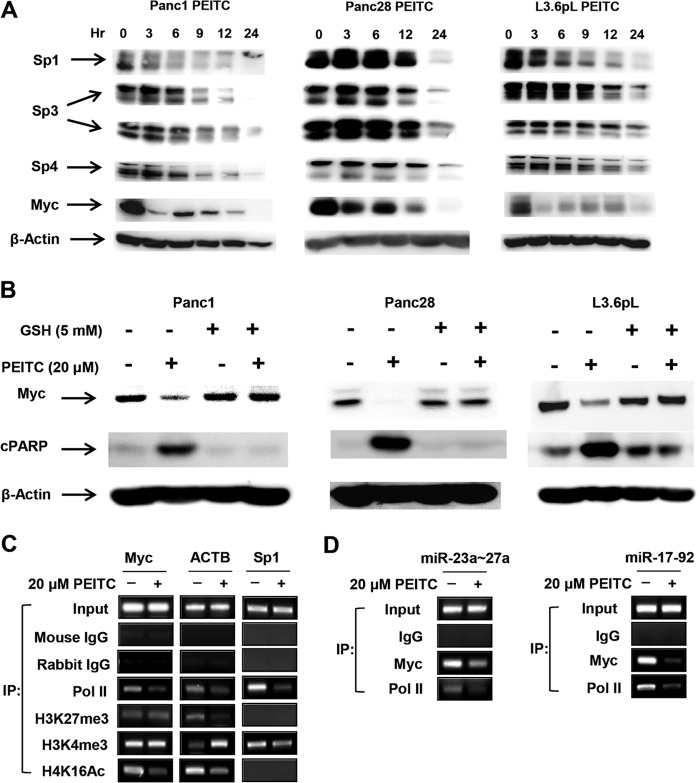
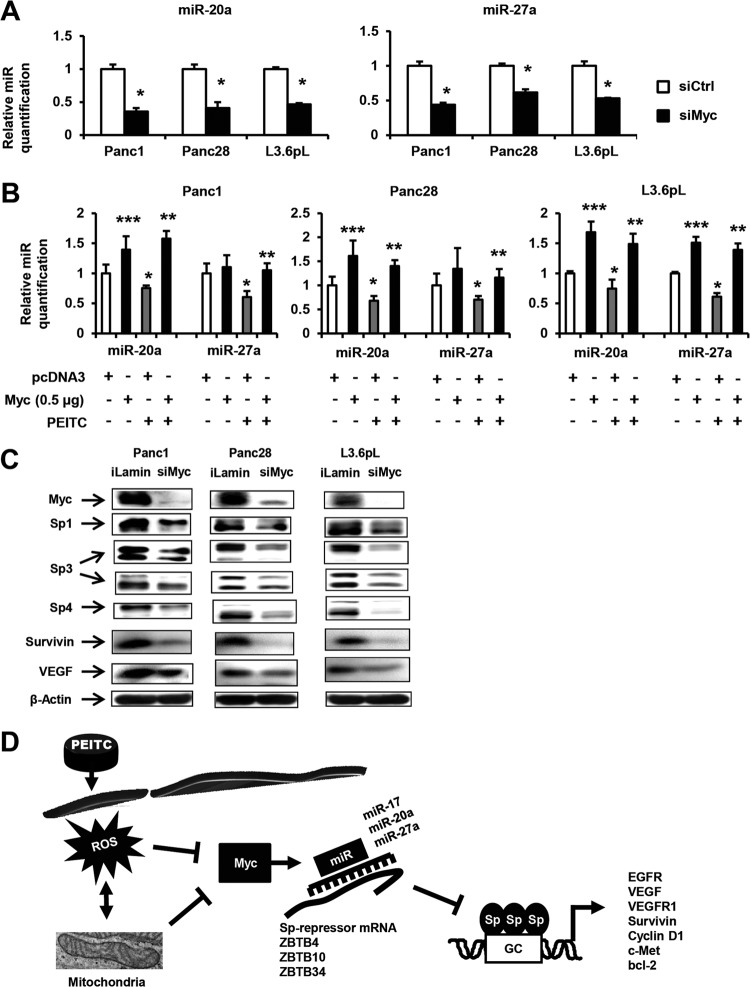
Reactive oxygen species (ROS)-inducing anticancer agents such as phenethylisothiocyanate (PEITC) activate stress pathways for killing cancer cells. Here we demonstrate that PEITC-induced ROS decreased expression of microRNA 27a (miR-27a)/miR-20a:miR-17-5p and induced miR-regulated ZBTB10/ZBTB4 and ZBTB34 transcriptional repressors, which, in turn, downregulate specificity protein (Sp) transcription factors (TFs) Sp1, Sp3, and Sp4 in pancreatic cancer cells. Decreased expression of miR-27a/miR-20a:miR-17-5p by PEITC-induced ROS is a key step in triggering the miR-ZBTB Sp cascade leading to downregulation of Sp TFs, and this is due to ROS-dependent epigenetic effects associated with genome-wide shifts in repressor complexes, resulting in decreased expression of Myc and the Myc-regulated miRs. Knockdown of Sp1 alone by RNA interference also induced apoptosis and decreased pancreatic cancer cell growth and invasion, indicating that downregulation of Sp transcription factors is an important common mechanism of action for PEITC and other ROS-inducing anticancer agents.


Figures

FIG 1
FIG 1
PEITC inhibits pancreatic cancer cell growth and induces ROS. (A) L3.6pL, Panc28, and Panc1 cells were treated with different concentrations of PEITC for up to 72 h, and cells were counted as outlined in Materials and Methods. Relative tumor weights after treatment with PEITC or corn oil (control) were determined as outlined in Materials and Methods, and a significant (P < 0.05) decrease in weight is indicated (*) (10 animals per treatment group). L3.6pL (B), Panc28 (C), and Panc1 (D) cells were treated with 20 μM PEITC, GSH, or their combination for 3 and 6 h, and ROS was determined by FACS analysis using the cell-permeant CM-H2DCFDA dye as described in Materials and Methods; effects observed after 3 and 6 h were quantitated (similar results were obtained in duplicate experiments).
FIG 2
FIG 2
PEITC disrupts mitochondrial structure and decreases MMP. L3.6pL, Panc28, and Panc1 cells were treated with 20 μM PEITC alone (A) or in combination with GSH (B), and mitochondrial ultrastructure was determined by TEM as outlined in Materials and Methods. The widths of the fields are 2 μm (A) and 5.3 μm (B). (C) Cells were treated with DMSO (solvent), 20 μM PEITC, or 5 mM GSH or GSH plus PEITC for the indicated times, and changes in MMP were determined by JC-1 staining as outlined in Materials and Methods. Results are means ± SE (3 replicates per data point), and significant (P < 0.05) inhibition (*) and reversal of the effect by GSH (**) are indicated. Red, JC-1 aggregates; green, JC-1 monomers.
FIG 3
FIG 3
Glutathione inhibits PEITC-induced apoptosis and growth inhibition. (A to C) L3.6pL (A), Panc28 (B), and Panc1 (C) cells were treated with 20 μM PEITC or GSH alone or in combination, and annexin V staining was determined as outlined in Materials and Methods. (D) Cell proliferation. Cells were treated as described for panels A to C for 24 h; cells were then counted as outlined in Materials and Methods. Results are means ± SE (3 replicates for each data point), and significant (P < 0.05) effects by PEITC (*) and attenuation by cotreatment with GSH (**) are indicated.
FIG 4
FIG 4
PEITC downregulates Sp1, Sp3, Sp4, and Sp-regulated genes. (A to C) Pancreatic cancer cells were treated with different concentrations of PEITC for 24 h, and whole-cell lysates were analyzed for Sp1, Sp3, and Sp proteins (A), prosurvival proteins (B), and growth-promoting and angiogenic proteins (C) by Western blotting as outlined in Materials and Methods. (D) Cells were treated with PEITC or GSH alone or in combination, and cell lysates were analyzed by Western blotting as indicated for panels A to C. Results are typical of duplicate analyses, which gave comparable results. (E) Western blots of tumor lysates from control and PEITC-treated animals bearing L3.6pL cells as xenografts and protein quantitation relative to controls. Data shown in panels A to C were from the same experiment.
FIG 5
FIG 5
(A and B) Prooncogenic activity of Sp1 in pancreatic cancer cells. Cell growth (A) and cell cycle progression (B). Panc1 and L3.6pL cells were transfected with two different oligonucleotides that silence Sp1 (siSp1I and siSp1II), and cell proliferation and cell cycle progression were determined by cell counting or FACS analysis as outlined in Materials and Methods. (C and D) Pancreatic cancer cell invasion and quantitation (C) and induction of apoptosis (D). Panc1 and L3.6pL cells were transfected with siSpI or siSp1II, and inhibition of cell migration in a Boyden chamber assay and induction of apoptosis were determined and quantitated relative to the control (siCT) as outlined in Materials and Methods. Results in panels A to C are expressed as means ± SE for at least 3 replicate determinations for each treatment group, and significant (P < 0.05) increases (*) or decreases (**) compared to a control group (siCT) are indicated.
FIG 6
FIG 6
PEITC disrupts miR-ZBTB interactions. (A) PEITC decreases miR expression. Pancreatic cancer cells were treated with 20 μM PEITC for 24 h, and miR expression was determined by real-time PCR as outlined in Materials and Methods. (B) GSH attenuates PEITC-mediated downregulation of miRs. Cells were treated with 20 μM PEITC, 5 mM GSH alone, or PEITC and GSH in combination for 24 h and analyzed for miR expression as outlined for panel A. (C) Induction of ZBTB expression. Cells were treated as described for panel B, and ZBTB4, ZBTB10, and ZBTB34 mRNA levels were determined by real-time PCR as outlined in Materials and Methods, and significant induction is indicated (*) (means ± SE for 3 replicate determinations). (D) ZBTB protein expression. Cells were treated with 20 μM PEITC for different times, and ZBTB protein expression was determined by Western blotting as outlined in Materials and Methods. Results for panels A to C are expressed as means ± SE for at least 3 replicate experiments for each treatment group; significant (P < 0.05) PEITC-induced responses (*) and attenuation by GSH (**) are indicated.
FIG 7
FIG 7
PEITC-induced responses are due to downregulation of Myc. (A) Time course effects on Sp transcription factors and Myc. Cells were treated with 20 μM PEITC for various times and analyzed by Western blotting as outlined in Materials and Methods. (B) GSH attenuates Myc downregulation by PEITC. Cells were treated with 20 μM PEITC, or 5 mM GSH alone, or PEITC and GSH in combination for 24 h, and whole-cell lysates were analyzed by Western blotting as outlined in Materials and Methods. (C and D) ChIP analysis of cMyc, Sp1, and ACTB (C) and the miR promoters (D). Cells were treated with 20 μM PEITC for 3 h, and histone methylation and acetylation marks on the Myc, ACTB, and Sp1 promoters (C) and Myc binding to the miR-23a/27a and miR-17-92 promoters (D) were determined in ChIP assays as outlined in Materials and Methods. Results are representative of replicate assays, and the various primers used (C and D) are listed in Materials and Methods.
FIG 8
FIG 8
Myc knockdown disrupts miR-ZBTB interactions and downregulates Sp proteins. (A) Knockdown of Myc by RNA interference (siMyc) in pancreatic cancer cells decreases expression of miRs. Panc1, Panc28, and L3.6pL cells were transfected with siMyc or a nonspecific oligonucleotide (siCtrl), and expression levels of miR-20a and miR-27a were determined by real-time PCR as outlined in Materials and Methods. (B) Myc overexpression inhibits PEITC-mediated suppression of miR-20a and miR-27a. Panc1, Panc28, and L3.6pL cells were treated with 20 μM PEITC and transfected with a Myc expression plasmid (pMyc) or empty vector (pcDNA3), and miR-20a and miR-27a expression was determined by real-time PCR as outlined in Materials and Methods. (C) Myc knockdown decreases Sp proteins in pancreatic cancer cells. Panc1, Panc28, and L3.6pL cells were transfected with siMyc or siLamin (control), and whole-cell lysates were isolated and analyzed by Western blotting as outlined in Materials and Methods. (D) Proposed mechanism of ROS-induced downregulation of Sp transcription factors. Results shown in panels A and B are means ± SE for replicate determinations, and significantly (P > 0.05) decreased expression (*) and rescue (**) are indicated. Significant upregulation by Myc overexpression is indicated (***).

References

    1. Lydon N. 2009. Attacking cancer at its foundation. Nat. Med. 15:1153–1157. 10.1038/nm1009-1153 - DOI - PubMed
    1. Fruehauf JP, Meyskens FL., Jr 2007. Reactive oxygen species: a breath of life or death? Clin. Cancer Res. 13:789–794. 10.1158/1078-0432.CCR-06-2082 - DOI - PubMed
    1. Trachootham D, Alexandre J, Huang P. 2009. Targeting cancer cells by ROS-mediated mechanisms: a radical therapeutic approach? Nat. Rev. Drug Discov. 8:579–591. 10.1038/nrd2803 - DOI - PubMed
    1. Engel RH, Evens AM. 2006. Oxidative stress and apoptosis: a new treatment paradigm in cancer. Front. Biosci. 11:300–312. 10.2741/1798 - DOI - PubMed
    1. Schumacker PT. 2006. Reactive oxygen species in cancer cells: live by the sword, die by the sword. Cancer Cell 10:175–176. 10.1016/j.ccr.2006.08.015 - DOI - PubMed

Publication types

MeSH terms

LinkOut - more resources