. 2014 Apr 14;9(4):e94764.
doi: 10.1371/journal.pone.0094764. eCollection 2014.

Matrix rigidity-modulated cardiovascular organoid formation from embryoid bodies

Affiliations

Matrix rigidity-modulated cardiovascular organoid formation from embryoid bodies

Artem Shkumatov et al. PLoS One. .

Abstract

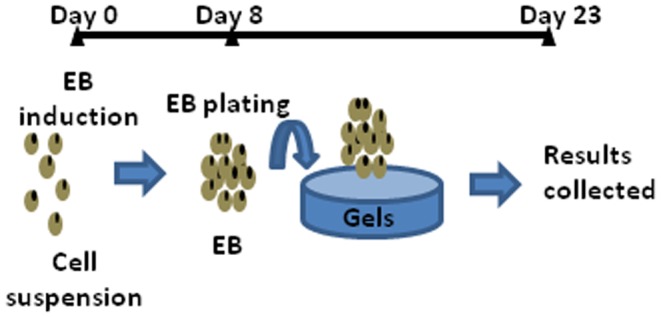
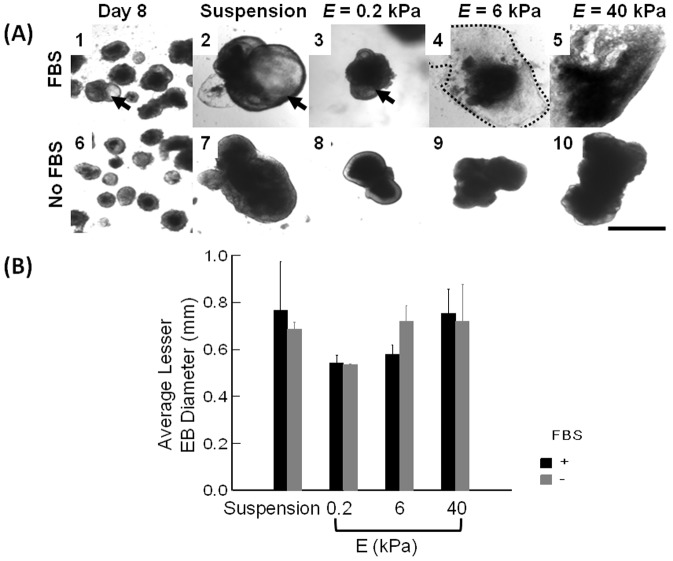
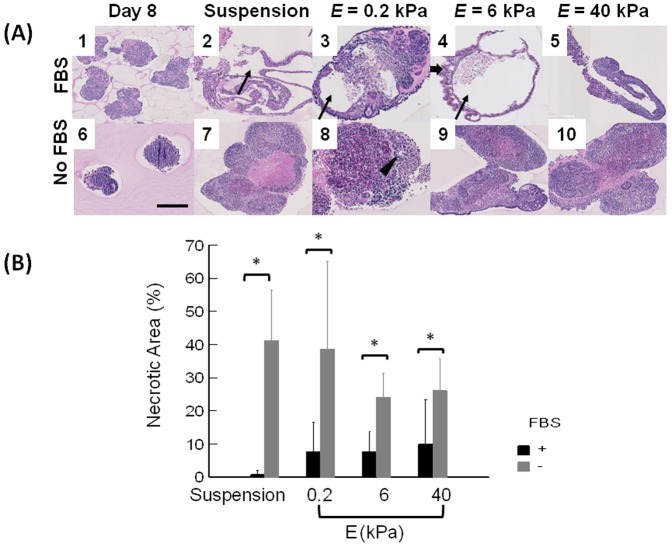
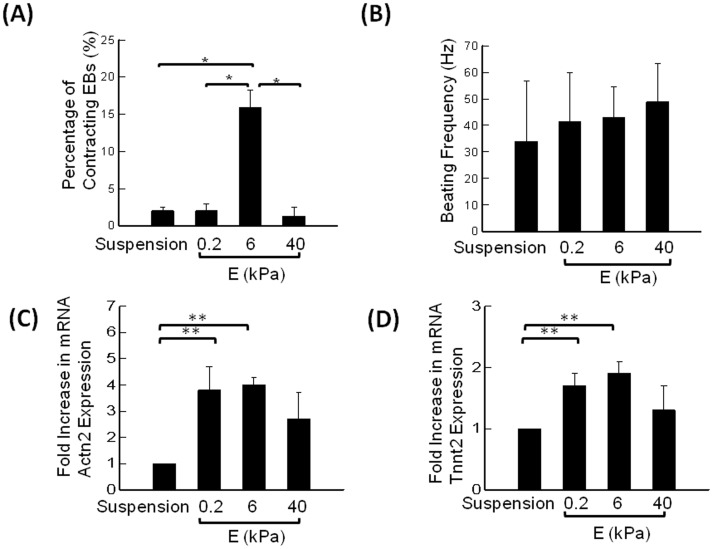
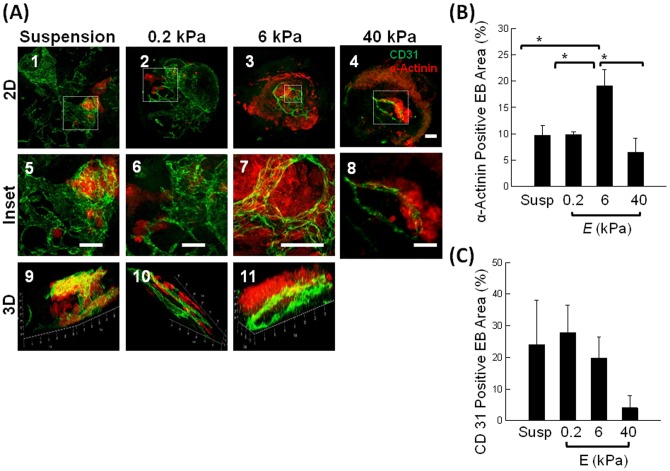
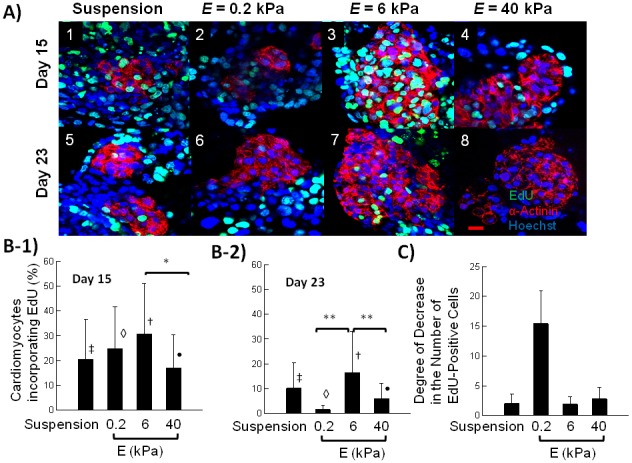
Stem cell clusters, such as embryoid bodies (EBs) derived from embryonic stem cells, are extensively studied for creation of multicellular clusters and complex functional tissues. It is common to control phenotypes of ES cells with varying molecular compounds; however, there is still a need to improve the controllability of cell differentiation, and thus, the quality of created tissue. This study demonstrates a simple but effective strategy to promote formation of vascularized cardiac muscle-like tissue in EBs and form contracting cardiovascular organoids by modulating the stiffness of a cell adherent hydrogel. Using collagen-conjugated polyacrylamide hydrogels with controlled elastic moduli, we discovered that cellular organization in a form of vascularized cardiac muscle sheet was maximal on the gel with the stiffness similar to cardiac muscle. We envisage that the results of this study will greatly contribute to better understanding of emergent behavior of stem cells in developmental and regeneration process and will also expedite translation of EB studies to drug-screening device assembly and clinical treatments.


Conflict of interest statement

Competing Interests: The authors have declared that no competing interests exist.

Figures

Figure 1
Figure 1. Schematic description of the experiment design.
EBs were formed from the suspension of ES cells during the first 8 days. Then, EBs were cultured in suspension, on the pure collagen gel with E of 0.2 kPa or CCP gels with E of 6 and 40 kPa for additional 15 days.
Figure 2
Figure 2. Size analysis of EBs cultured in suspended state or on hydrogels with controlled elastic moduli.
(A) Bright field images of EBs. (A-1 and A-6) EBs formed by culturing ES cells in suspended state for 8 days. (A-2 and A-7) EBs cultured in suspended state for additional 15 days. (A-3 and A-8) EBs cultured on the pure collagen gel with E of 0.2 kPa, (A-4 and A-9) EBs cultured on the CCP gel with E of 6 kPa, and (A-5 and A-10) EBs cultured on the CCP gel with E of 40 kPa. Images in the first and second rows represent EBs cultured in medium supplemented with 10% FBS and that without FBS, respectively. Arrows in A-1 to A-3 indicate cystic EBs. The scale bar represents 1 mm. (B) The quantified analysis of average diameters of EBs cultured in suspended state or on collagen-based hydrogels of controlled E. Black bars represent average diameter of EBs cultured in the medium supplemented with 10% FBS, and grey bars represent EBs cultured without FBS. Values and error bars represent the mean and the standard error of at least 50 EBs, respectively. No statistical significance was found between conditions.
Figure 3
Figure 3. Histological analysis of EBs cultured in suspended state or on hydrogels with controlled elastic moduli.
Cross-sections of EBs were stained with Hematoxylin & Eosin. (A) (A-1 and A-6) EBs formed by culturing ES cells in suspended state for 8 days. (A-2 and A-7) EBs cultured in suspended state for additional 15 days. (A-3 and A-8) EBs cultured on the pure collagen gel with E of 0.2 kPa, (A-4 and A-9) EBs cultured on the CCP gel with E of 6 kPa, and (A-5 and A-10) EBs cultured on the CCP gel with E of 40 kPa. Images on the first and second rows represent EBs cultured in medium supplemented with 10% FBS and that without FBS, respectively. Thin arrows in A-2, 3, and 4 indicate cystic EBs. The thick arrow in A-4 indicates columnar epithelium, and the arrowhead in A-8 indicates a neuroectodermal rosette. Scale bar represents 250 µm. (B) Quantified necrotic area percentage of EBs cultured in suspension and on hydrogels with E of 0.2, 6, and 40 kPa. Black bars represent average diameter of EBs cultured in media supplemented with 10% FBS and grey bars do those cultured without FBS. The difference of values for EBs cultured in the medium supplemented with 10% FBS (black bar) and free of FBS (grey bar) is statistically significant for all four different conditions (*p<0.05). Values and error bars represent the mean and the standard deviation of at least 10 EBs, respectively.
Figure 4
Figure 4. Analysis of stiffness-modulated contraction in EBs.
(A) Percentage of contracting EBs. The difference of the values between EBs cultured on the gel with E of 6 kPa and other three conditions is statistically significant (*p<0.05). Values and error bars represent the mean and the standard error of at least 100 EBs, respectively. (B) Frequency of EB contractions. Values and error bars represent the mean and the standard deviation of at least 5 EBs, respectively. (C) Effects of E of the hydrogel on the sarcomeric α-actinin (Actn2) mRNA expression. (D) Effects of E of the hydrogel on cardiac troponin T type 2 (Tnnt2) mRNA expression. Values and error bars represent the mean and the standard error. In (C) and (D), * indicate statistical significance of difference between conditions (*p<0.05).
Figure 5
Figure 5. Immunohistochemical analysis of cardiomyogenic and endothelial differentiation within EBs.
(A) Fluorescent images of EBs stained for sarcomeric α-actinin (red) and CD31 (green). (A-1, 5, & 9) EBs cultured in suspended state for 23 days. (A-2, 6 & 10) EBs cultured on the pure collagen gel with E of 0.2 kPa. (A-3, 7, & 11) EBs cultured on the CCP gel with E of 6 kPa. (A-4 & 8) EBs cultured on the CCP gel with E of 40 kPa. Scale bar represents 200 µm. Images on the second row are magnified views of those on the first row. Images on the third row are three-dimensional confocal images of EBs. (B) Percentage of the EB area positively stained by antibodies to sarcomeric α-actinin. The difference of the values between EBs cultured on the gel with E of 6 kPa and other three conditions is statistically significant (*p<0.05). (C) Percentage of EB area positively stained with an antibody to CD31. The difference of the values between EBs cultured on the gel with E of 6 and 40 kPa is statistically not significant (*p>0.1). Values and error bars represent the mean and the standard error of at least 20 EBs, respectively.
Figure 6
Figure 6. Cell cycle analysis of cardiomyoblasts using EdU incorporation.
(A) Fluorescent images of sarcomeric α-actinin positive cells (red) incorporating EdU (green). Blue color represents cell nuclei stained by Hoechst 33342. Images represent EBs cultured in suspended state (A-1 and A-5) and on hydrogels with E of 0.2 (A-2 and A-5), 6 (A-3 and A-5), and 40 kPa (A-4 and A-5). Scale bar represents 20 µm. Images on the first row were taken on Day 15, and those on the second row were taken on Day 23. (B) Quantified percentage of cardiomyoblasts incorporating EdU on Day 15 (B-1) and 23 (B-2). In (B-1), the difference of values between EBs cultured on the gel with E of 6 kPa and 40 kPa was statistically significant (*p<0.05). In (B-2), the difference of values between EBs cultured on the gel with E of 6 kPa and EBs on the gels with E of 0.2 and 40 kPa was statistically significant (**p<0.05). Symbols ‡, ◊, †, •, *, ** and brackets indicate statistically significant groups (p<0.05). (C) The degree of decrease in the percentage of cardiomyoblasts incorporating EdU between Day 15 and Day 23.

Similar articles

Cited by

References

    1. Carpenedo RL, Sargent CY, McDevitt TC (2007) Rotary suspension culture enhances the efficiency, yield, and homogeneity of embryoid body differentiation. Stem Cells 25: 2224–2234. - PubMed
    1. Liang Y, Jeong J, DeVolder RJ, Cha C, Wang F, et al. (2011) A cell-instructive hydrogel to regulate malignancy of 3D tumor spheroids with matrix rigidity. Biomaterials 32: 9308–9315. - PubMed
    1. Wobus AM, Kaomei G, Shan J, Wellner MC, Rohwedel J, et al. (1997) Retinoic acid accelerates embryonic stem cell-derived cardiac differentiation and enhances development of ventricular cardiomyocytes. J Mol Cell Cardiol 29: 1525–1539. - PubMed
    1. McBurney MW, Jones-Villeneuve EM, Edwards MK, Anderson PJ (1982) Control of muscle and neuronal differentiation in a cultured embryonal carcinoma cell line. Nature 299: 165–167. - PubMed
    1. Yamashita J, Itoh H, Hirashima M, Ogawa M, Nishikawa S, et al. (2000) Flk1-positive cells derived from embryonic stem cells serve as vascular progenitors. Nature 408: 92–96. - PubMed

Publication types