. 2014 May;5(5):357-68.
doi: 10.1007/s13238-014-0038-z. Epub 2014 Apr 15.

Elimination of inter-domain interactions increases the cleavage fidelity of the restriction endonuclease DraIII

Affiliations

Elimination of inter-domain interactions increases the cleavage fidelity of the restriction endonuclease DraIII

Wei Zhuo et al. Protein Cell. 2014 May.

Abstract

DraIII is a type IIP restriction endonucleases (REases) that recognizes and creates a double strand break within the gapped palindromic sequence CAC↑NNN↓GTG of double-stranded DNA (↑ indicates nicking on the bottom strand; ↓ indicates nicking on the top strand). However, wild type DraIII shows significant star activity. In this study, it was found that the prominent star site is CAT↑GTT↓GTG, consisting of a star 5' half (CAT) and a canonical 3' half (GTG). DraIII nicks the 3' canonical half site at a faster rate than the 5' star half site, in contrast to the similar rate with the canonical full site. The crystal structure of the DraIII protein was solved. It indicated, as supported by mutagenesis, that DraIII possesses a ββα-metal HNH active site. The structure revealed extensive intra-molecular interactions between the N-terminal domain and the C-terminal domain containing the HNH active site. Disruptions of these interactions through site-directed mutagenesis drastically increased cleavage fidelity. The understanding of fidelity mechanisms will enable generation of high fidelity REases.


Figures

Figure 1
Figure 1
Determination ofDraIII Fidelity Index (FI) and star sites. (A) Determination of DraIII Fidelity Index (FI). λ DNA (1.6 nmol/L; 16 nmol/L CACNNNGTG sites) is digested by DraIII in a series of two fold dilutions. DraIII concentration: Lane 1, 3.2 μmol/L; Lane 10, 6.25 nmol/L; Lane 11, 3.125 nmol/L; Lane 21, 3.05 pmol/L; Lane 22, 1-kb DNA Ladder (NEB). The vertical arrows indicate the two critical points: HNS—the Highest REases concentration showing No Star activity and LCC—the Lowest REase concentration needed for Complete Cleavage on canonical sites. FI = HNS/LCC, which is 2 in this case. Asterisk represents a star band, and the hash represents a band that resulted from partial cleavage of λ DNA. The theoretical digestion pattern of DraIII to λ DNA was predicted using NEBcutter (Vincze et al., 2003) and was shown on the left. (B) DraIII star site in pUC19 was predicted to be the CATGTTGTG site. Lane 1: BamHI (cut at nt 417) and XmnI (cut at nt 2298) double digestion on pUC19 generated the 1.9-kb and 0.8-kb bands. Lane 2: BamHI, XmnI and DraIII triple digestion on pUC19. Asterisk indicates the star band. According to the approximate size of star bands, the CATGTTGTG site (nt 2033) was hypothesized to be the DraIII star site. Cleavage on predicted CATGTTGTG site generated the 1.6-kb and 0.3-kb star bands. Lane 3: 1-kb DNA Ladder. (C) DraIII star activity cleaves the CATGTTGTG site in pXba. Lane 1: 1-kb DNA Ladder. Lane 2: pXba was digested by DraIII. Asterisk indicates the star bands. DraIII star activity generates the expected 6.5-kb and 4.5-kb star bands on pXba. (D) DraIII star activity shows selectivity to the central “NNN” part of CATNNNGTG site. There are 11 CATNNNGTG sites in pXba and the sequences containing these sites were tested independently on oligonucleotide duplex DNAs carrying each of the sites (Table S1). The canonical CACGGCGTG site was used as positive control. DraIII shows cleavage activity to CATATGGTG, CATTACGTG, CATGTGGTG, CATAAAGTG and CATGTTGTG sites. DraIII did not cut the pseudo-palindromic CATGTTATG site
Figure 2
Figure 2
DraIII digests star site sequence in asymmetrical pattern. (A) Sequences of Cy5-labeled DNA substrates. (B) Star activity cleavage occurs in CAT↑GTT↓GTG. Cy5-labeled canonical or star DNA was digested by DraIII as described in Supplementary EXPERIMENTAL. The single strand product was separated by TBE urea polyacrylmide gel and compared with synthesized single-stranded markers. Star activity cleavage occurs in CAT↑GTT↓GTG (↑ indicates nicking on the bottom strand; ↓ indicates nicking on the top strand). (C and D) DraIII digests a star site sequence in an asymmetrical manner. 100 nmol/L Cy5-labeled star DNA was digested by 500 nmol/L DraIII. The samples were collected at the designated time intervals and were analyzed by electrophoresis using TBE urea polyacrylmide gel. The amount of the quantified products was plotted against time
Figure 3
Figure 3
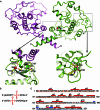
TheDraIII overall protein structure. (A) The complete DraIII structure derived in the presence of magnesium chloride. The ion binding motifs are shown. (B) The 11-bp phosphorothioate canonical DNA duplex. (C) The secondary structure of the DraIII subunit. Elements of secondary structure are indicated by α-helix (red rectangle) and β-strand (blue arrow). Catalytic residues of the HNH endonuclease motif are indicated with blue font. Zinc-binding cysteine residues are indicated with red font. The location of N-terminal domain, C-terminal domain and ββα-metal motif is indicated by the orange, cyan and black underlines respectively
Figure 4
Figure 4
Comparison of the sequence and structures of HNH REases. (A) Sequence alignment of the DraIII, Hpy99I, PacI, T4 Endo VII and KpnI HNH catalytic motif. (B–D) DraIII HNH motif (orange) aligned to Hpy991 (B: cyan, PDB 3GOX), PacI (C: green, PDB 3M7K) and T4 Endo VII (D: blue, PDB 2QNF), respectively. The zinc ion is shown as green sphere, magnesium ion and DNA are shown in red
Figure 5
Figure 5
The interactions between the N-terminal domain and C-terminal domain ofDraIII subunit. (A) DraIII subunit structure. N-terminal domain in orange; C-terminal domain in cyan; Zinc in green; Magnesium in red. Left: DraIII subunit displayed in surface mode. Right: DraIII subunit displayed in cartoon mode. Interactions in the mouth, middle region and hydrophobic residues in the hinge region were shown in gray boxes. The locations of potential hydrogen bonds are indicated with red dotted line. (B) Determination FI of DraIII T181A. λ DNA was cleaved by diluted T181A. Lane 1: 3.2 μmol/L T181A; Lane 13: 0.78 nmol/L (LCC); Lane 21: 3.05 pmol/L; Lane 22: 1-kb DNA Ladder. FI is larger than 4000. The hash represents a partially digested band. No star band was observed. Disrupting hydrogen bond between T181 and D55 in the middle region remarkably enhanced FI

Similar articles

Cited by

References

    1. Adams PD, Grosse-Kunstleve RW, Hung LW, Ioerger TR, McCoy AJ, Moriarty NW, Read RJ, Sacchettini JC, Sauter NK, Terwilliger TC. PHENIX: building new software for automated crystallographic structure determination. Acta Crystallogr. 2002;58:1948–1954. - PubMed
    1. Chan SH, Opitz L, Higgins L, O’Loane D, Xu SY. Cofactor requirement of HpyAV restriction endonuclease. PLoS ONE. 2010;5:e9071. doi: 10.1371/journal.pone.0009071. - DOI - PMC - PubMed
    1. Collaborative Computational Project, Number 4 The CCP4 suite: programs for protein crystallography. Acta Crystallogr. 1994;50:760–763. - PubMed
    1. Cowtan KD. DM: an automated procedure for phase improvement by density modification. CCP4 Newslett. 1994;31:34–38.
    1. Cowtan K. The Buccaneer software for automated model building. 1. Tracing protein chains. Acta Crystallogr. 2006;62:1002–1011. doi: 10.1107/S0108767306098266. - DOI - PubMed

Publication types

MeSH terms