

Trends in prevalence and control of diabetes in the United States, 1988-1994 and 1999-2010
- PMID: 24733192
- PMCID: PMC4442608
- DOI: 10.7326/M13-2411
Trends in prevalence and control of diabetes in the United States, 1988-1994 and 1999-2010
Abstract
Background: Trends in the prevalence and control of diabetes defined by hemoglobin A1c (HbA1c) levels are important for health care policy and planning.
Objective: To update trends in the prevalence of diabetes, prediabetes, and glycemic control.
Design: Cross-sectional.
Setting: NHANES (National Health and Nutrition Examination Survey) in 1988-1994 and 1999-2010.
Participants: Adults aged 20 years or older.
Measurements: We used calibrated HbA1c levels to define undiagnosed diabetes (≥6.5%); prediabetes (5.7% to 6.4%); and, among persons with diagnosed diabetes, glycemic control (<7.0% or <8.0%). Trends in HbA1c categories were compared with fasting glucose levels (≥7.0 mmol/L [≥126 mg/dL] and 5.6 to 6.9 mmol/L [100 to 125 mg/dL]).
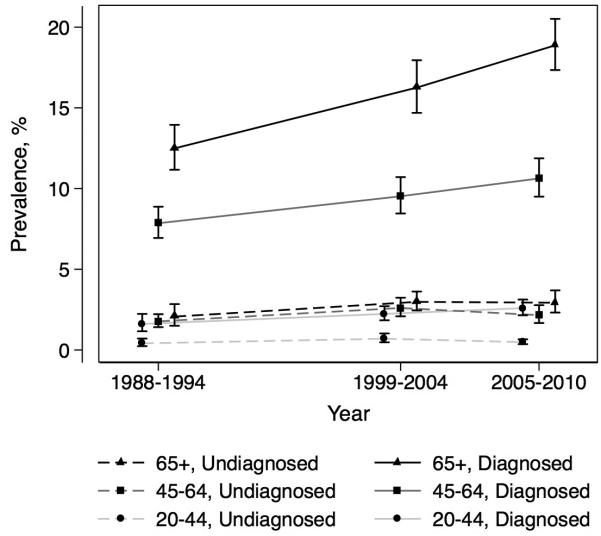
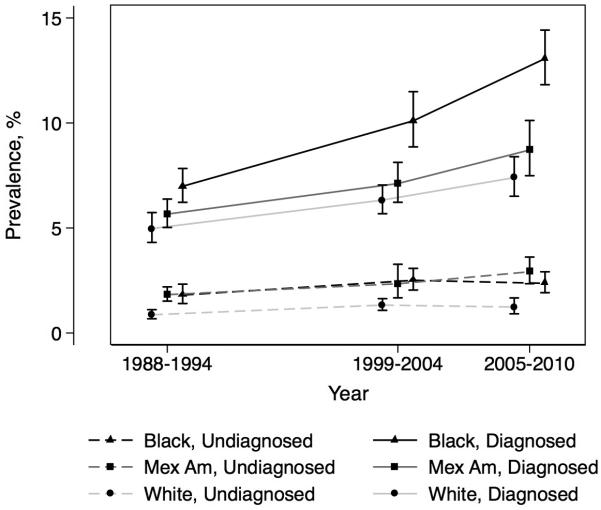
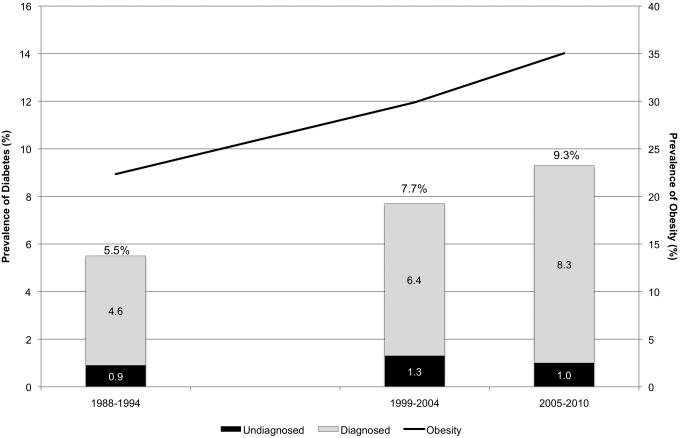
Results: In 2010, approximately 21 million U.S. adults aged 20 years or older had total confirmed diabetes (self-reported diabetes or diagnostic levels for both fasting glucose and calibrated HbA1c). During 2 decades, the prevalence of total confirmed diabetes increased, but the prevalence of undiagnosed diabetes remained fairly stable, reducing the proportion of total diabetes cases that are undiagnosed to 11% in 2005-2010. The prevalence of prediabetes was lower when defined by calibrated HbA1c levels than when defined by fasting glucose levels but has increased from 5.8% in 1988-1994 to 12.4% in 2005-2010 when defined by HbA1c levels. Glycemic control improved overall, but total diabetes prevalence was greater and diabetes was less controlled among non-Hispanic blacks and Mexican Americans compared with non-Hispanic whites.
Limitation: Cross-sectional design.
Conclusion: Over the past 2 decades, the prevalence of total diabetes has increased substantially. However, the proportion of undiagnosed diabetes cases decreased, suggesting improvements in screening and diagnosis. Among the growing number of persons with diagnosed diabetes, glycemic control improved but remains a challenge, particularly among non-Hispanic blacks and Mexican Americans.
Primary funding source: National Institutes of Health.
Figures
Comment in
-
Diabetes, prediabetes, and glycemic control in the United States: challenges and opportunities.Ann Intern Med. 2014 Apr 15;160(8):572-3. doi: 10.7326/M14-0539. Ann Intern Med. 2014. PMID: 24733201 No abstract available.
References
-
- Flegal KM, Carroll MD, Ogden CL, Curtin LR. Prevalence and trends in obesity among US adults, 1999-2008. JAMA. 2010;303(3):235–41. PMID: 20071471. - PubMed
-
- Flegal KM, Carroll MD, Kuczmarski RJ, Johnson CL. Overweight and obesity in the United States: prevalence and trends, 1960-1994. Int J Obes Relat Metab Disord. 1998;22(1):39–47. PMID: 9481598. - PubMed
-
- Mokdad AH, Ford ES, Bowman BA, Nelson DE, Engelgau MM, Vinicor F, et al. Diabetes trends in the U.S.: 1990-1998. Diabetes Care. 2000;23(9):1278–83. PMID: 10977060. - PubMed
-
- Trends in the Prevalence and Incidence of Self-Reported Diabetes Mellitus — United States, 1980–1994. Morbidity and Mortality Weekly Report. 1997;46(43):1014–8. PMID: - PubMed
Publication types
MeSH terms
Substances
Grants and funding
LinkOut - more resources
Full Text Sources
Other Literature Sources
Medical
Miscellaneous