. 2013:78:81-90.
doi: 10.1101/sqb.2013.78.020339. Epub 2014 Apr 14.

The "histone mimicry" by pathogens

Affiliations

The "histone mimicry" by pathogens

Uwe Schaefer et al. Cold Spring Harb Symp Quant Biol. 2013.

Abstract

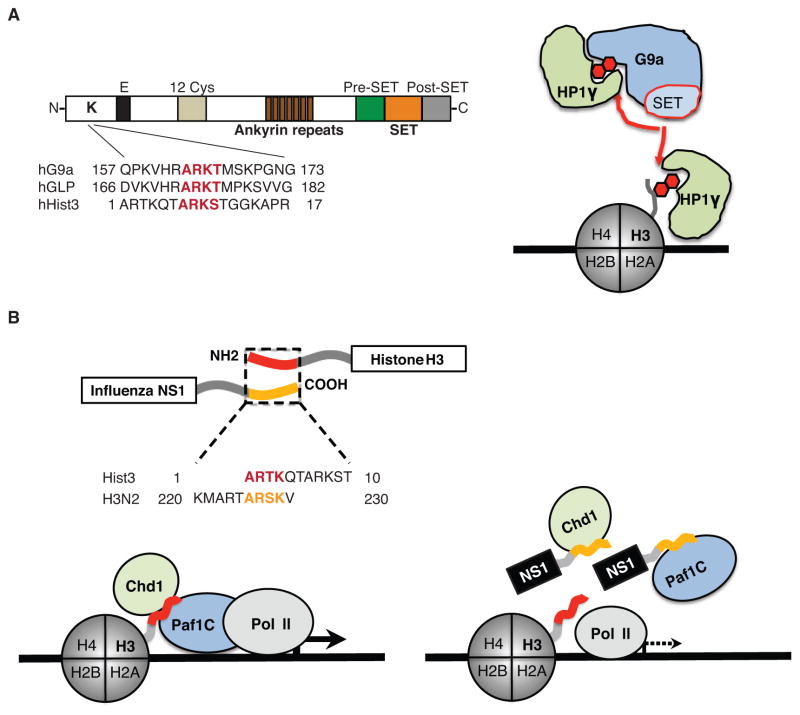
One of the defining characteristics of human and animal viruses is their ability to suppress host antiviral responses. Viruses express proteins that impair the detection of viral nucleic acids by host pattern-recognition receptors, block signaling pathways that lead to the synthesis of type I interferons and other cytokines, or prevent the activation of virus-induced genes. We have identified a novel mechanism of virus-mediated suppression of antiviral gene expression that relies on the presence of histone-like sequences (histone mimics) in viral proteins. We describe how viral histone mimics can interfere with key regulators of gene expression and contribute to the suppression of antiviral responses. We also describe how viral histone mimics can facilitate the identification of novel mechanisms of antiviral gene regulation and lead to the development of drugs that use histone mimicry for interference with gene expression during diseases.


Figures

Figure 1
Figure 1. The structure and function of histone mimics
A. The methyltransferases G9a and GLP possess a functional histone mimic. The histone-like sequence (red letters) is localized within the N-terminal domain of the proteins (Sampath et al. 2007). The G9a histone mimic methylation (red hexagon) is mediated in cis by the catalytic SET domain (Sampath et al. 2007) that is flanked by pre- and post-SET domains. The ankyrin repeat domain is involved in G9a interaction with methylated histones (Collins et al. 2008), and the methylated histone mimic in G9a (red hexagon) binds to the chromodomain-containing protein HP1γ that can also interact with methylated histone H3 (red hexagon). B. The NS1 proteins of the influenza A H3N2 virus possess a functional histone H3K4-like sequence. The histone-like sequence of NS1 (yellow letters) is localized within the non-structured carboxy-terminus of the protein whereas the homologous H3 sequence (red letters) is localized within the amino-terminus of histone H3 (Marazzi et al. 2012). The NS1 histone mimic (yellow tail) is present in the nucleus (Greenspan et al. 1988) where it interacts with Paf1 and Chd1 proteins. Interaction with Chd1 depends on NS1 lysine methylation, whereas Paf1 can bind to the unmethylated or methylated NS1 histone mimic. The pattern of Paf1 and Chd1 binding to NS1 is similar to these protein interactions with histone H3. The schematic model describes a putative mechanism of NS1 interference with Paf1-mediated transcription of virus-induced genes.
Figure 2
Figure 2. Virus infection leads to Paf1 recruitment to the virus activated gene loci
A. A549 lung epithelia cells were infected with PR8/ΔNS1 virus that due to the lack of NS1 induces strong antiviral responses. The virus infection resulted in time-dependent increase (red) or decrease (blue) in Paf1 binding. The heatmap shows relative abundance of Paf1 binding to the gene transcriptional start sites (TSS) in control or infected cells as determined by ChIP-sequencing. Grey boxes at the right of the heat map indicate known interferon stimulated genes (ISGs) (Schoggins et al. 2011). B. The table shows the top five functional categories associated with genes that display > 2-fold change in Paf1 binding at 12 hours (h) after infection. C. Virus infection increases Paf1 abundance at key antiviral genes. Binding of H3K4me3 (green), Paf1 (blue) and Pol II (black) at virus-induced genes in non-infected cells (0 hours) and PR8/ΔNS1-infected cells at 4 hours and 12 hours post infection is shown. The y-axes represent the average number of tags per gene per 25 base pairs per 1,000,000 mapped reads. Scale values are indicated in parentheses. D. Virus induced Paf1 binding correlates with recruitment of RNA Pol II to antiviral gene loci. The plot shows the cumulative distribution function (CDF) of changes in Pol II binding to different groups of Pol II or Paf1-bound genes at 12 hours post infection with influenza PR8/ΔNS1. Genes that change Paf1 binding upon infection: red line; all genes that bind Paf1: black line; all genes that bind Pol II: green line. The broken grey line indicates a fold change of 1. E. Virus induced Paf1 binding correlates with up-regulation of antiviral gene expression. The plot shows the CDF of changes in gene expression for different groups of Paf1-associated genes at 12 hours post infection with influenza PR8/ΔNS1. Genes that change Paf1 binding upon infection: red line; all genes that bind Paf1: black line; genes that do not bind to Paf1: blue line; all genes: yellow line. The broken grey line indicates a fold change of 1. F. Paf1 deficiency down-regulates selectively expression of genes that recruit Paf1 during infection. The plot shows the CDF of Paf1 binding levels (log2 RPKM/bp) in non-infected A549 cells (left), in A549 cells 4 hours post infection with influenza PR8/ΔNS1 (middle), or 12 hours post infection (right) for genes that were suppressed by Paf1 knockdown (dark blue line), up-regulated by Paf1-deficiency (orange line), or for all genes (black line).
Figure 3
Figure 3. I-BET suppresses the antiviral response
A. Venn diagrams display the number of virus-induced genes (> 2-fold, yellow circle) that were suppressed (> 2-fold, green circle) by I-BET treatment of A549 cells at 4 hours or 12 hours after infection with influenza PR8/ΔNS1. The scatter plot shows gene expression levels in control (x-axis) versus I-BET-treated cells (y-axis) at 4 hours after infection. The down- or up-regulated genes are shown in green or red, respectively. A black circle highlights genes that play an important role in antiviral response. The broken black line indicates a 2-fold change in expression; the dotted black line indicates a 10-fold change in expression. B. Venn diagrams display the number of IFNβ-induced genes (> 2-fold, orange circle) that were suppressed (> 2-fold, green circle) by I-BET treatment of A549 cells at 4 hours or 12 hours after incubation with IFNβ. The scatter plot shows gene expression levels in control (x-axis) versus I-BET-treated cells (y-axis) at 4 hours after IFNβ treatment. The down- or up-regulated genes are shown in green or red, respectively. A black circle highlights examples of genes that play an important role for the cellular antiviral response. The broken black line indicates a 2-fold change in expression; the dotted black line indicates a 10-fold change in expression. C. I-BET increases virus growth in vitro. The kinetics of influenza PR8/ΔNS1 virus replication in control (black circle) or I-BET-treated A549 cells (red circle) has been measured as described (Marazzi et al. 2012). The viral replication in I-BET treated cells was compared to viral replication in Paf1-deficient A549 cells (blue triangle) that display significant increase in viral replication as compared to control cells (black triangle).

References

    1. Ashour J, Laurent-Rolle M, Shi PY, Garcia-Sastre A. NS5 of dengue virus mediates STAT2 binding and degradation. J Virol. 2009;83:5408–5418. - PMC - PubMed
    1. Badeaux AI, Shi Y. Emerging roles for chromatin as a signal integration and storage platform. Nat Rev Mol Cell Biol. 2013;14:211–224. - PMC - PubMed
    1. Ballestas ME, Chatis PA, Kaye KM. Efficient persistence of extrachromosomal KSHV DNA mediated by latency-associated nuclear antigen. Science. 1999;284:641–644. - PubMed
    1. Banerjee P, DeJesus R, Gjoerup O, Schaffhausen BS. Viral interference with DNA repair by targeting of the single-stranded DNA binding protein RPA. PLoS Pathog. 2013;9:e1003725. - PMC - PubMed
    1. Bao Y, Bolotov P, Dernovoy D, Kiryutin B, Zaslavsky L, Tatusova T, Ostell J, Lipman D. The influenza virus resource at the National Center for Biotechnology Information. J Virol. 2008;82:596–601. - PMC - PubMed

Publication types

LinkOut - more resources