. 2014 Apr 14;9(4):e95265.
doi: 10.1371/journal.pone.0095265. eCollection 2014.

Mitochondrial morphological features are associated with fission and fusion events

Affiliations

Mitochondrial morphological features are associated with fission and fusion events

Laura M Westrate et al. PLoS One. .

Abstract

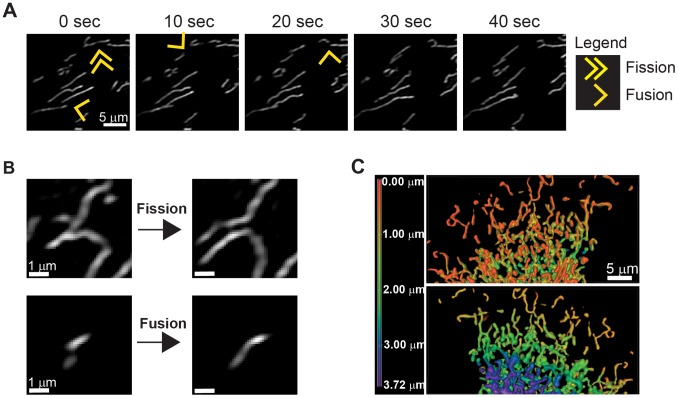
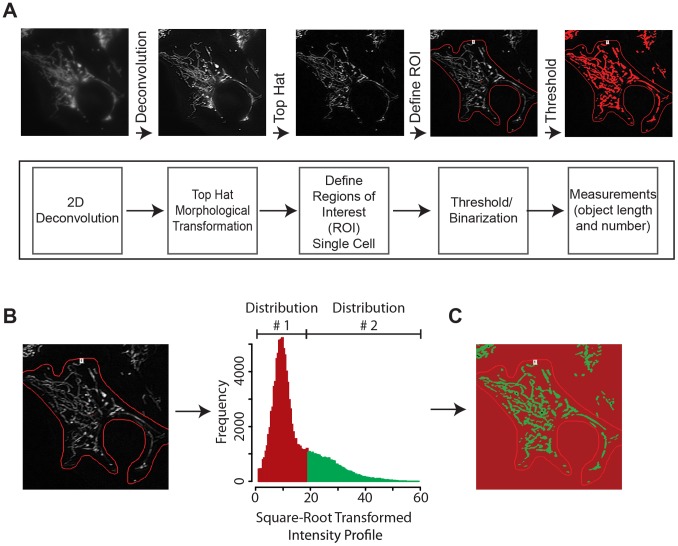
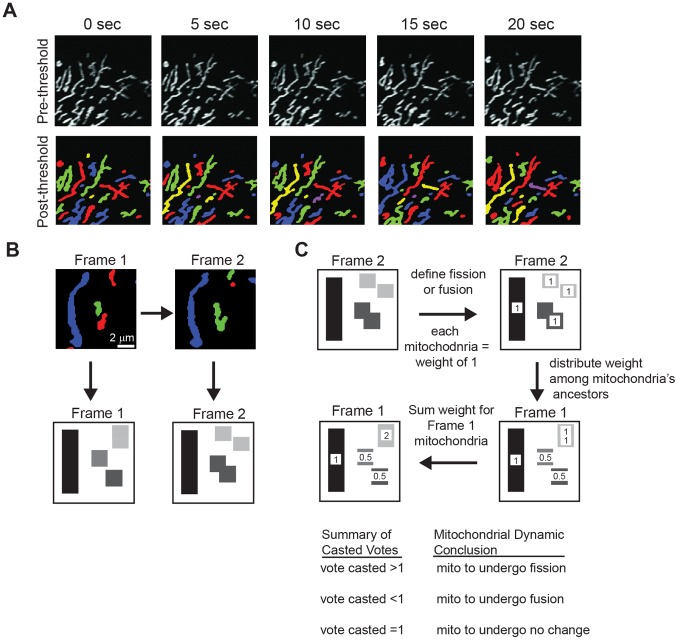
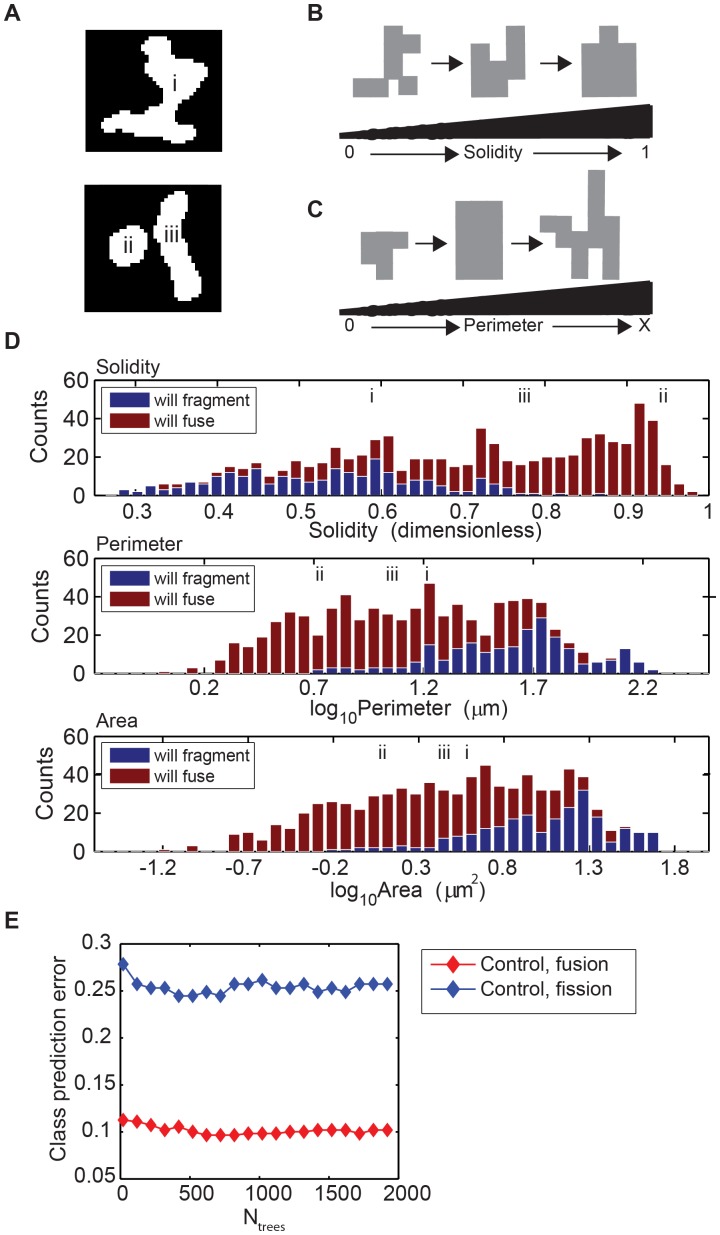
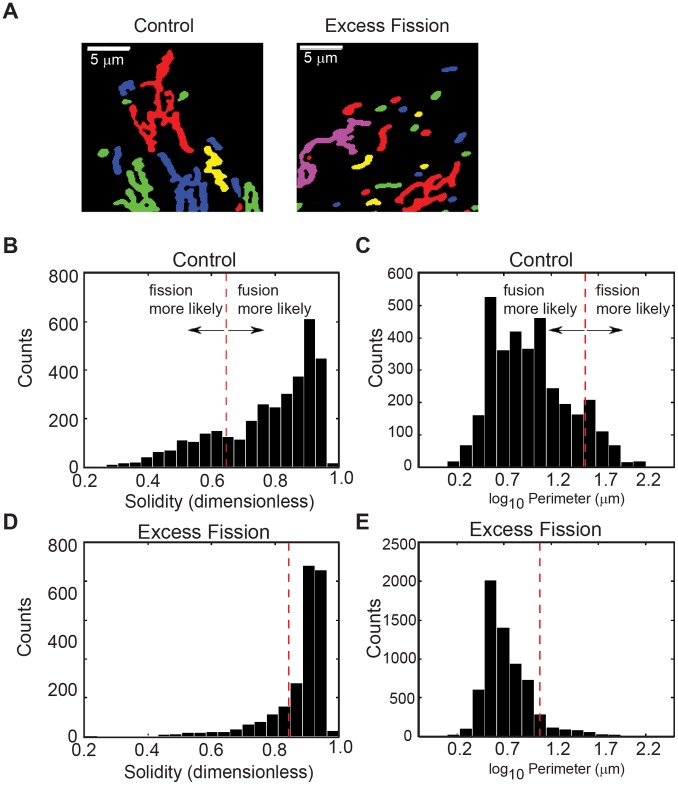
Mitochondria are dynamic organelles that undergo constant remodeling through the regulation of two opposing processes, mitochondrial fission and fusion. Although several key regulators and physiological stimuli have been identified to control mitochondrial fission and fusion, the role of mitochondrial morphology in the two processes remains to be determined. To address this knowledge gap, we investigated whether morphological features extracted from time-lapse live-cell images of mitochondria could be used to predict mitochondrial fate. That is, we asked if we could predict whether a mitochondrion is likely to participate in a fission or fusion event based on its current shape and local environment. Using live-cell microscopy, image analysis software, and supervised machine learning, we characterized mitochondrial dynamics with single-organelle resolution to identify features of mitochondria that are predictive of fission and fusion events. A random forest (RF) model was trained to correctly classify mitochondria poised for either fission or fusion based on a series of morphological and positional features for each organelle. Of the features we evaluated, mitochondrial perimeter positively correlated with mitochondria about to undergo a fission event. Similarly mitochondrial solidity (compact shape) positively correlated with mitochondria about to undergo a fusion event. Our results indicate that fission and fusion are positively correlated with mitochondrial morphological features; and therefore, mitochondrial fission and fusion may be influenced by the mechanical properties of mitochondrial membranes.


Conflict of interest statement

Competing Interests: The authors have declared that no competing interests exist.

Figures

Figure 1
Figure 1. Mitochondrial reticulum undergoes constant morphological remodeling.
(A) Time-lapse images of U2OS cells stably expressing mito_EYFP demonstrate fission and fusion events in real time. Double arrows highlight a mitochondrion about to undergo a mitochondrial fission event, while single arrows highlight a mitochondrion about to undergo a mitochondrial fusion event. (B) High magnification (5x) of mitochondrial morphology prior to a mitochondrial fission or fusion event illustrating that heavily branched mitochondria tend to fragment while small, more compact mitochondria tend to fuse. (C) 3D- rendering of mitochondrial z-stack from a U2OS mito_EYFP cell with the mitochondria color coded red to blue to indicate depth of view. The z-stack represents only a portion of the cell with the nucleus oriented beneath the image and the mitochondria extending radially out towards the periphery.
Figure 2
Figure 2. Quantification design for tracking mitochondrial morphology dynamics using mito_EYFP.
(A) Quantification schematic used to process images for analysis. Mitochondria were imaged in U2OS_mitoEYFP cells by fluorescent microscopy and were subjected to image processing that involved 2D deconvolution, top hat morphological transformation, intensity thresholding, and object quantification. (B) Intensity profiles from each individual cell were used to determine the thresholding boundaries for each image. Intensity profiles depict single distribution with a prominent right-hand elbow that we separated and termed distribution 1 and 2: pixels within distribution 1 are highlighted red and represent non-mitochondrial pixels whereas pixels within distribution 2 are highlighted green and represent mitochondrial pixels. (C) Split color of mitochondrial image in 1B highlighting location of pixels within each distribution. Mitochondrial measurements were performed with a threshold that excluded pixels in distribution 1.
Figure 3
Figure 3. Quantitative characterization of mitochondrial fission and fusion events.
(A) Thresholded images following the schematic described in Figure 2 segregates individual mitochondria to be tracked for identification of fission or fusion events. (B) Mitochondria in Frame 1 and 2 were tracked as discrete regions through time to monitor for fission and fusion events. (C) Simplified diagram illustrating quantitative characterization of a fission and fusion event occurring amongst mitochondria as they progress from one frame to the next (Frame 1 to Frame 2). Mitochondria in Frame 1 with a score of less than 1 will undergo a mitochondrial fusion event in Frame 2. Mitochondria in Frame 1 with a score higher than 1 are marked as mitochondria that will undergo a mitochondrial fission even tin Frame 2. Mitochondria with a score of 1 will undergo neither a fission or fusion event in Frame 2.
Figure 4
Figure 4. Mitochondrial features, solidity, perimeter, and area, segregate mitochondria classified to fragment or fuse.
(A) Thresholded mitochondria annotated i–iii represent three examples of mitochondria identified to undergo a fission or fusion event in the subsequent frame and will be used in panel B to provide context for the shape and size of the mitochondria at different stages along the x-axis (see i–iii notation in population distributions for solidity, perimeter, and area). (B) Mitochondrial solidity is defined as the fraction of pixels contained with a convex polygon (fitted around a mitochondrion) that is also mitochondrial pixels. Low solidity (close to 0) tends to describe highly tortuous mitochondria that are not uniform in shape while high solidity values (closer to 1) tends to describe mitochondria that are more uniform in shape and do not contain a high level of branching. (C) Mitochondrial perimeter is defined as the number of exterior mitochondrial pixels multiplied by the length of the pixels, in microns. While perimeter and area of mitochondria are highly correlated, mitochondria of similar area can have varied perimeters depending on the level of branching and morphology complexity. (D) Feature distributions of solidity, perimeter, and area. The red and blue histograms characterize the distribution of solidity (top), perimeter (middle), and area (bottom) across the population of mitochondria poised to undergo fusion or fission, respectively. Values are binned as indicated on each axis and the number of mitochondria mapping to each bin is indicated on each y axis. (E) Class prediction errors for the random forests calculated for fusion events (red) and fission events (blue). Error decreases as the size of the forest exceeds ∼100 trees and reaches a minimum shortly thereafter.
Figure 5
Figure 5. Characterization of mitochondrial health and function.
(A) Immunofluorescent images of U2OS cells following targeted knockdown of OPA1 compared to control for 48 hours. Cells were labeled with MitoTracker Red CMXros (mitochondria, red), Phalloidin (actin, green), and Hoechst (nuclei, blue). (B) Immunofluorescent images of U2OS cells labeling endogenous cytochrome c (red) and nuclei (blue, Hoechst) following 48 hours of knockdown for OPA1 and control. (C) Knockdown was confirmed by probing for endogenous OPA1 protein levels via western blot (Untreated – lysates from untreated cells, Mock – lysates from cells transfected with lipid only, Control – lysates from cells transfected with control nonspecific siRNA, OPA 1 and 2– lysates from cells transfected with two different siRNA targeted against OPA1). (D) Respiratory potential of OPA1 knockdown cells (48 hrs) compared to control using the Seahorse metabolic analyzer. Real time measurements of oxygen consumption rate (OCR) were obtained basally and then after treatment with oligomycin (ATP synthase inhibitor), FCCP (ETC accelerator), and Rotenone+Antimycin (ETC inhibitors).
Figure 6
Figure 6. Morphological characterization of mitochondria from fission mutants.
(A) Thresholded mitochondria in U2OS_mitoEYFP cells following 48 hour knockdown with control or OPA1 specific siRNA. (B–E) Probability distribution of solidity and perimeter measurements for all mitochondria despite whether they will fragment or fuse in control cells (B and C, respectively) and OPA1 knockdown cells (D and E, respectively). Dashed red lines indicate decision boundary computed from a single classification tree fixed to one bifurcation, trained only on the data from fragmenting/fusing mitochondria in the feature in question.

Similar articles

Cited by

References

    1. Youle RJ, van der Bliek AM (2012) Mitochondrial fission, fusion, and stress. Science 337: 1062–1065. - PMC - PubMed
    1. Chan DC (2012) Fusion and fission: interlinked processes critical for mitochondrial health. Annu Rev Genet 46: 265–287. - PubMed
    1. Chan DC (2006) Mitochondria: dynamic organelles in disease, aging, and development. Cell 125: 1241–1252. - PubMed
    1. Ono T, Isobe K, Nakada K, Hayashi JI (2001) Human cells are protected from mitochondrial dysfunction by complementation of DNA products in fused mitochondria. Nat Genet 28: 272–275. - PubMed
    1. Twig G, Elorza A, Molina AJ, Mohamed H, Wikstrom JD, et al. (2008) Fission and selective fusion govern mitochondrial segregation and elimination by autophagy. EMBO J 27: 433–446. - PMC - PubMed

Publication types