. 2014 Sep;22(9):2535-45.
doi: 10.1007/s00520-014-2204-5. Epub 2014 Apr 15.

Sleep, fatigue, depression, and circadian activity rhythms in women with breast cancer before and after treatment: a 1-year longitudinal study

Affiliations

Sleep, fatigue, depression, and circadian activity rhythms in women with breast cancer before and after treatment: a 1-year longitudinal study

Sonia Ancoli-Israel et al. Support Care Cancer. 2014 Sep.

Abstract

Purpose: Sleep disturbance, fatigue and depression are common complaints in patients with cancer, and often contribute to worse quality of life (QoL). Circadian activity rhythms (CARs) are often disrupted in cancer patients. These symptoms worsen during treatment, but less is known about their long-term trajectory.

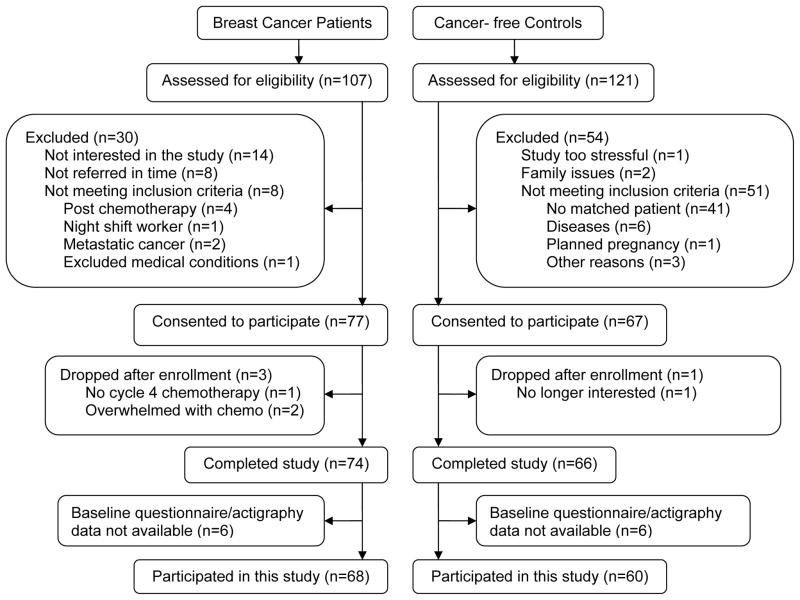
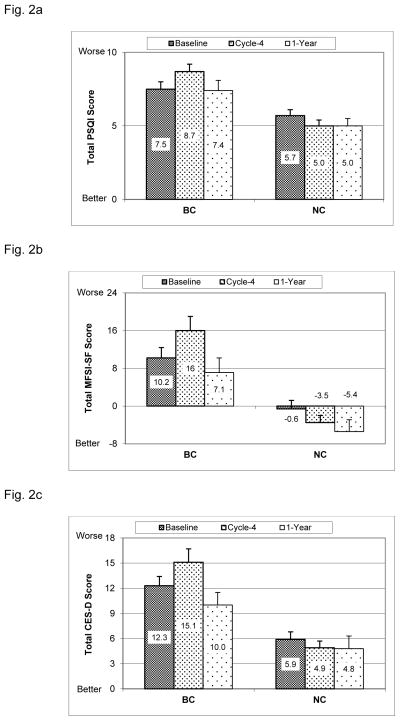
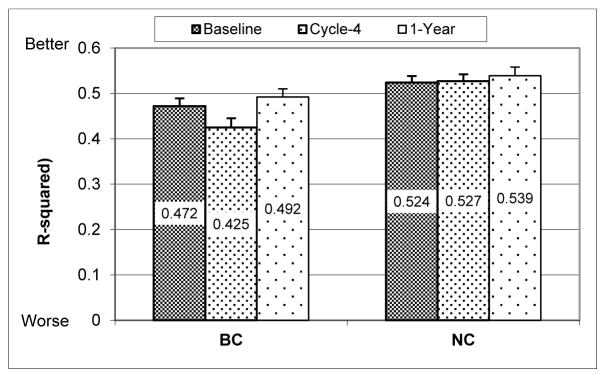
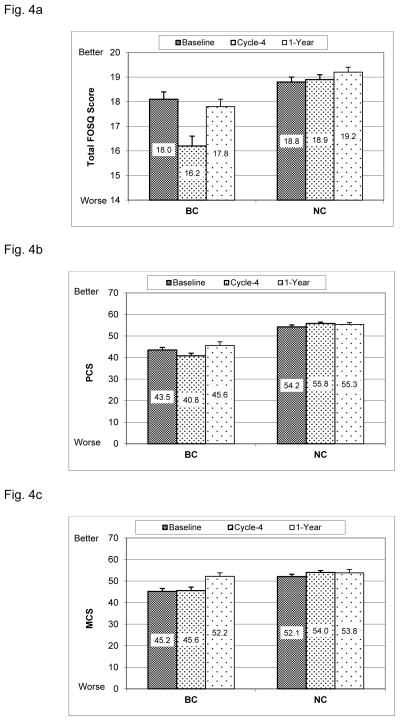
Methods: Sixty-eight women with stage I-III breast cancer (BC) scheduled to receive ≥4 cycles of chemotherapy, and age-, ethnicity-, and education-matched normal, cancer-free controls (NC) participated. Sleep was measured with actigraphy (nocturnal total sleep time [nocturnal TST] and daytime total nap time [NAPTIME]) and with the Pittsburgh Sleep Quality Index (PSQI); fatigue with the Multidimensional Fatigue Symptom Inventory-Short Form (MFSI-SF); depression with the Center of Epidemiological Studies-Depression (CES-D). CARs were derived from actigraphy. Several measures of QoL were administered. Data were collected at three time points: before (baseline), end of cycle 4 (cycle 4), and 1 year post-chemotherapy (1 year).

Results: Compared to NC, BC had longer NAPTIME, worse sleep quality, more fatigue, more depressive symptoms, more disrupted CARs, and worse QoL at baseline (all p values <0.05). At cycle 4, BC showed worse sleep, increased fatigue, more depressive symptoms, and more disrupted CARs compared to their own baseline levels and to NC (all p values <0.05). By 1 year, BC's fatigue, depressive symptoms, and QoL returned to baseline levels but were still worse than those of NC, while NAPTIME and CARs did not differ from NC's.

Conclusion: Additional research is needed to determine if beginning treatment of these symptoms before the start of chemotherapy will minimize symptom severity over time.


Conflict of interest statement

Conflict of Interest: The study was funded by NIH. The corresponding author has full control of all primary data and agrees to allow the Journal to review the data if requested.

Figures

Fig. 1
Fig. 1
Screening and Enrollment Flowchart
Fig. 2
Fig. 2. Sleep, Fatigue and Depressive symptoms
(mean+SE). BC= breast cancer patients, NC= cancer-free controls. Baseline = before the start of chemotherapy, Cycle-4 = at the end of cycle 4 chemotherapy, 1-Year = 1 year after the start of chemotherapy. Age and BMI were adjusted in the mixed model. Fig. 2a. PSQI (Pittsburgh Sleep Quality Index, higher score indicates poorer sleep quality): Between groups (group effect p<0.0001): Baseline p=0.011; Cycle-4 p<0.0001; Year-1 p=0.020. Within BC group (time effect p=0.0003): changes form Baseline to Cycle-4 p=0.030; from Cycle-4 to Year-1 p=0.0018. No significant within-group changes for NC. Group-x-time interaction p=0.0030. Fig. 2b: MFSI-SF (Multidimensional Fatigue Symptom Inventory-Short Form, higher score indicates more fatigue): Between groups (group effect p<0.0001): Baseline p=0.0019; Cycle-4 p<0.0001; Year-1 p=0.0091. Within BC group (time effect p<0.0001): changes from Baseline to Cycle-4 p=0.0031; from Cycle-4 to 1-Year p<0.0001. No significant within-group changes for NC. Group-x-time interaction p=0.0097. Fig. 2c: CES-D (Center of Epidemiological Studies-Depression, higher score indicates more depressive symptoms): Between groups (group effect p<0.0001): Baseline p=0.0003; Cycle-4 p<0.0001; Year-1 p=0.039. Within BC group (time effect p<0.0001): changes from Baseline to Cycle-4 p=0.0087; from Cycle-4 to 1-Year p<0.0001; from Baseline to 1-Year p=0.037. No significant within-group changes for NC. Group-x-time interaction p=0.0093.
Fig. 3
Fig. 3. Robustness of circadian activity rhythm
(mean+SE, bigger R-squared value indicates more robust rhythm). BC= breast cancer patients, NC= cancer-free controls. Baseline = before the start of chemotherapy, Cycle-4 = at the end of cycle 4 chemotherapy, 1-Year = 1 year after the start of chemotherapy. Age and BMI were adjusted in the mixed model. Between groups (group effect p=0.0039): Baseline p=0.047; Cycle-4 p=0.0001; 1-Year p=0.47. Within BC group (time effect p=0.0014): changes from Baseline to Cycle-4 p=0.014; from Cycle-4 to 1-Year p=0.0004. No significant within-group changes for NC. Group-x-time interaction p=0.042.
Fig. 4
Fig. 4. Quality of life
(mean+SE, higher scores indicate better QoL). BC= breast cancer patients, NC= cancer-free controls. Baseline = before the start of chemotherapy, Cycle-4 = at the end of cycle 4 chemotherapy, 1-Year = 1 year after the start of chemotherapy. Age and BMI were adjusted in the mixed model. Fig. 4a: FOSQ (Functional Outcomes of Sleep Questionnaire): Between groups (group effect p<0.0001): Baseline p=0.039; Cycle-4 p<0.0001; Year-1 p=0.029. Within BC group (time effect p<0.0001): changes from Baseline to Cycle-4 p<0.0001; from Cycle-4 to 1-Year p<0.0001. No significant within-group changes for NC. Group-x-time interaction p<0.0001. Fig. 4b: PCS (SF-36 Physical Component Summary): Between groups (group effect p<0.0001): Baseline p<0.0001; Cycle-4 p<0.0001; Year-1 p<0.0001. Within BC group (time effect p<0.0001): changes from Baseline to Cycle-4 p=0.013; from Cycle-4 to 1-Year p<0.0001; from Baseline to 1-Year p=0.021. No significant within-group changes for NC. Group-x-time interaction p=0.0060. Fig. 4c: MCS (SF-36 Metal Component Summary): Between groups (group effect p=0.0026): Baseline p=0.0010; Cycle-4 p<0.0001; 1-Year p=0.79. Within BC group (time effect p<0.0001): changes from Baseline to 1-Year p<0.0001; from Cycle-4 to 1-Year p<0.0001. No significant within-group changes for NC. Group-x-time interaction p=0.014.

References

    1. Fernandes R, Stone P, Andrews P, Morgan R, Sharma S. Comparison between fatigue, sleep disturbance, and circadian rhythm in cancer inpatients and healthy volunteers: evaluation of diagnostic criteria for cancer-related fatigue. J Pain Symptom Manage. 2006;32:245–254. - PubMed
    1. Esther Kim JE, Dodd MJ, Aouizerat BE, Jahan T, Miaskowski C. A review of the prevalence and impact of multiple symptoms in oncology patients. J Pain Symptom Manage. 2009;37:715–736. - PMC - PubMed
    1. Ancoli-Israel S, Liu L, Marler M, Parker BA, Jones V, Robins Sadler G, Dimsdale JE, Cohen-Zion M, Fiorentino L. Fatigue, sleep and circadian rhythms prior to chemotherapy for breast cancer. Support Care Cancer. 2006;14:201–209. - PMC - PubMed
    1. Berger AM, Farr LA, Kuhn BR, Fischer P, Agrawal S. Values of Sleep/Wake, Activity/Rest, Circadian Rhythms, and Fatigue Prior to Adjuvant Breast Cancer Chemotherapy. J Pain Symptom Manage. 2007;33:398–409. - PMC - PubMed
    1. Miaskowski C, Lee K, Dunn L, Dodd M, Aouizerat BE, West C, Paul SM, Cooper B, Wara W, Swift P. Sleep-wake circadian activity rhythm parameters and fatigue in oncology patients before the initiation of radiation therapy. Cancer Nurs. 2011;34:255–268. - PMC - PubMed

Publication types