Clinical Trial
. 2014 May 15;192(10):4833-43.
doi: 10.4049/jimmunol.1400062. Epub 2014 Apr 14.

Maturation of innate responses to mycobacteria over the first nine months of life

Affiliations
Clinical Trial

Maturation of innate responses to mycobacteria over the first nine months of life

Muki S Shey et al. J Immunol. .

Abstract

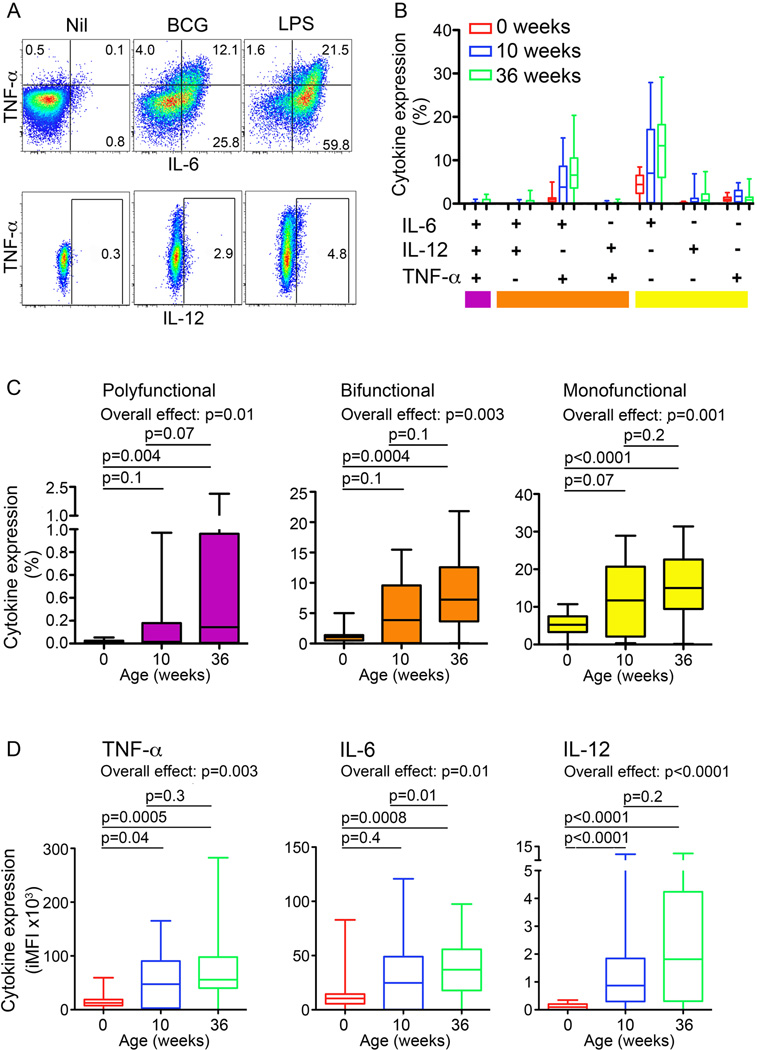
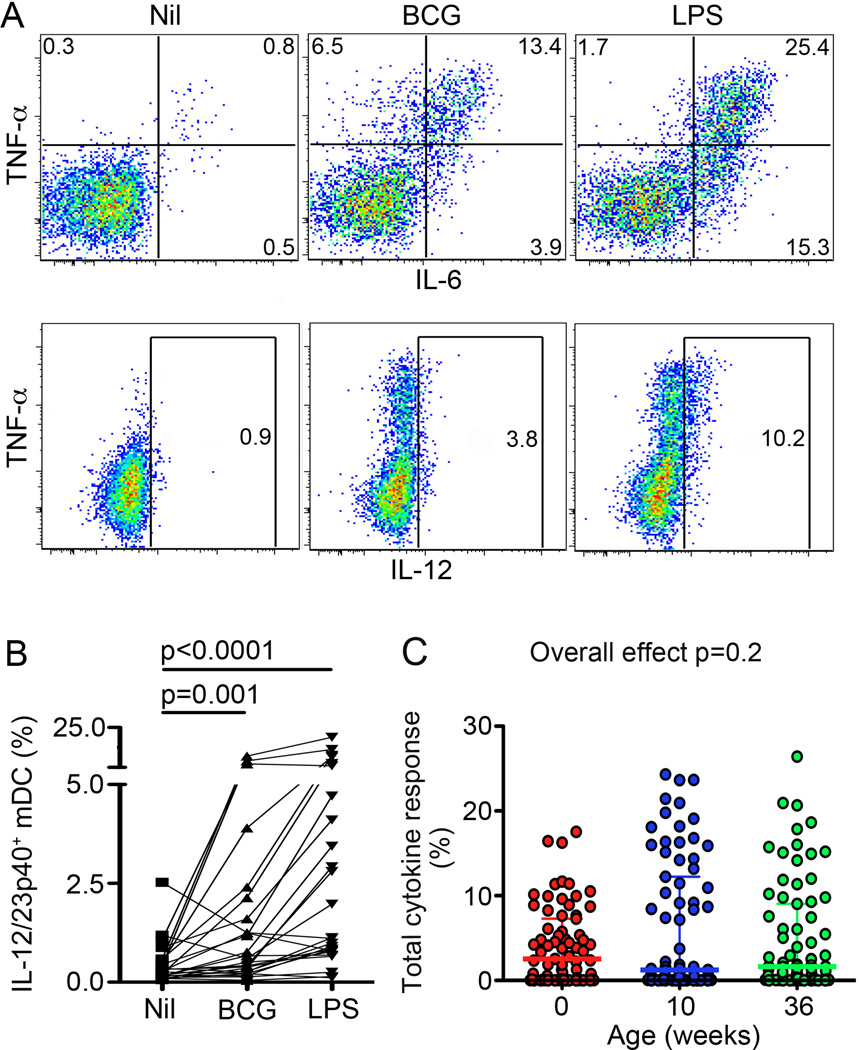
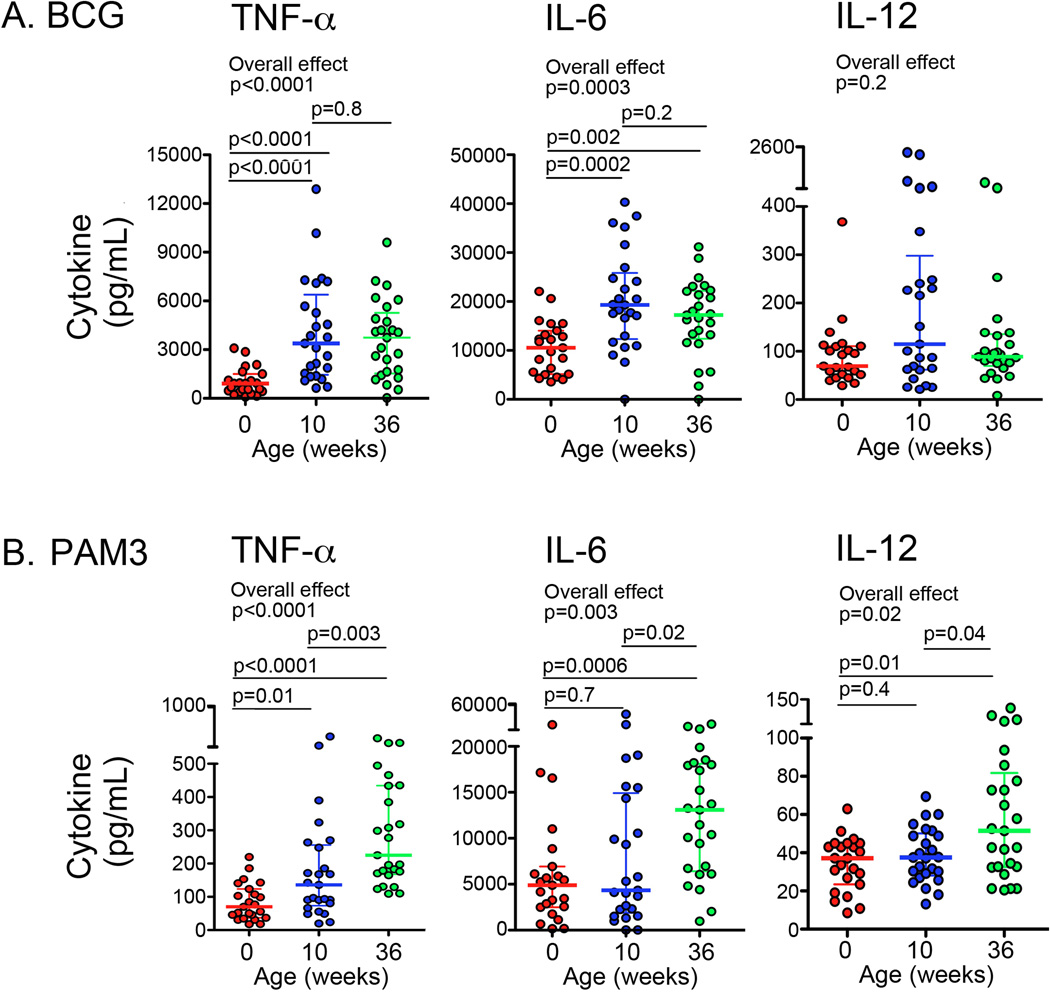
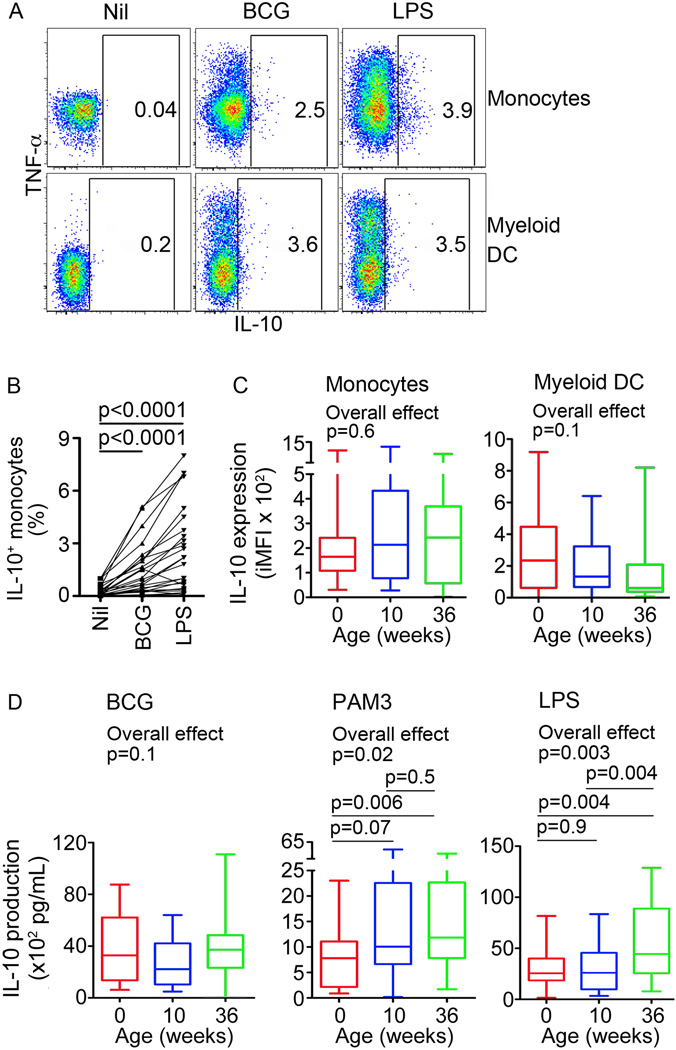
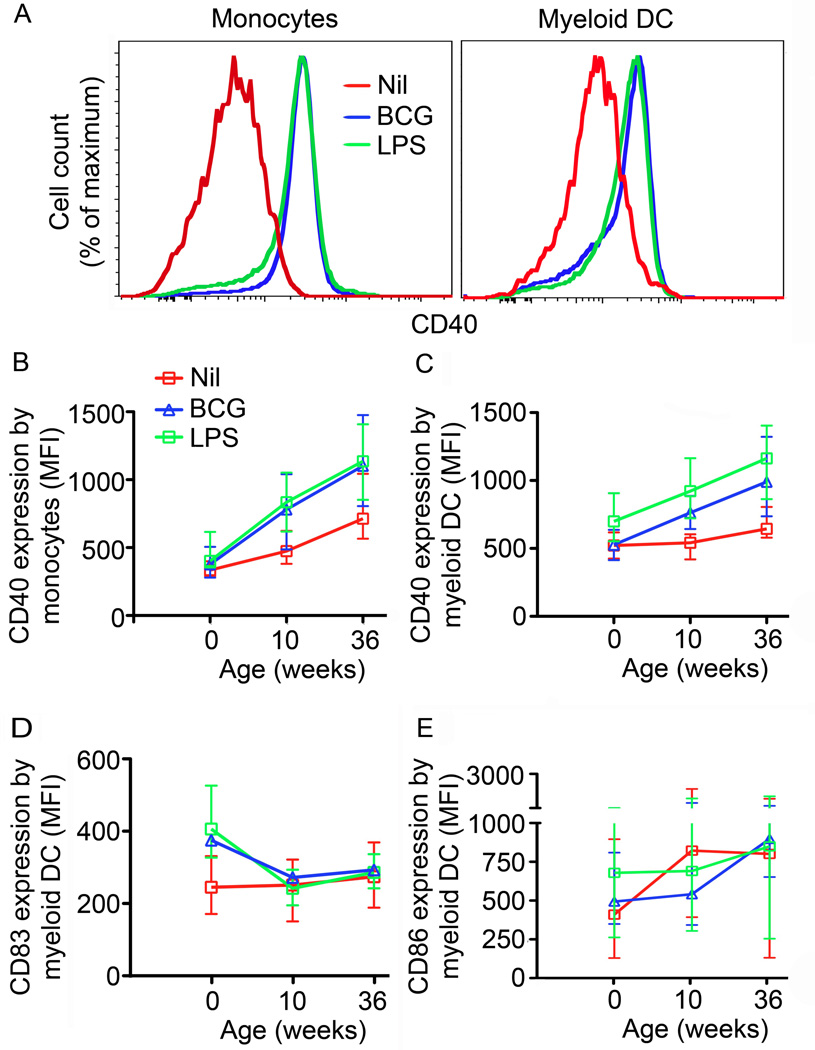
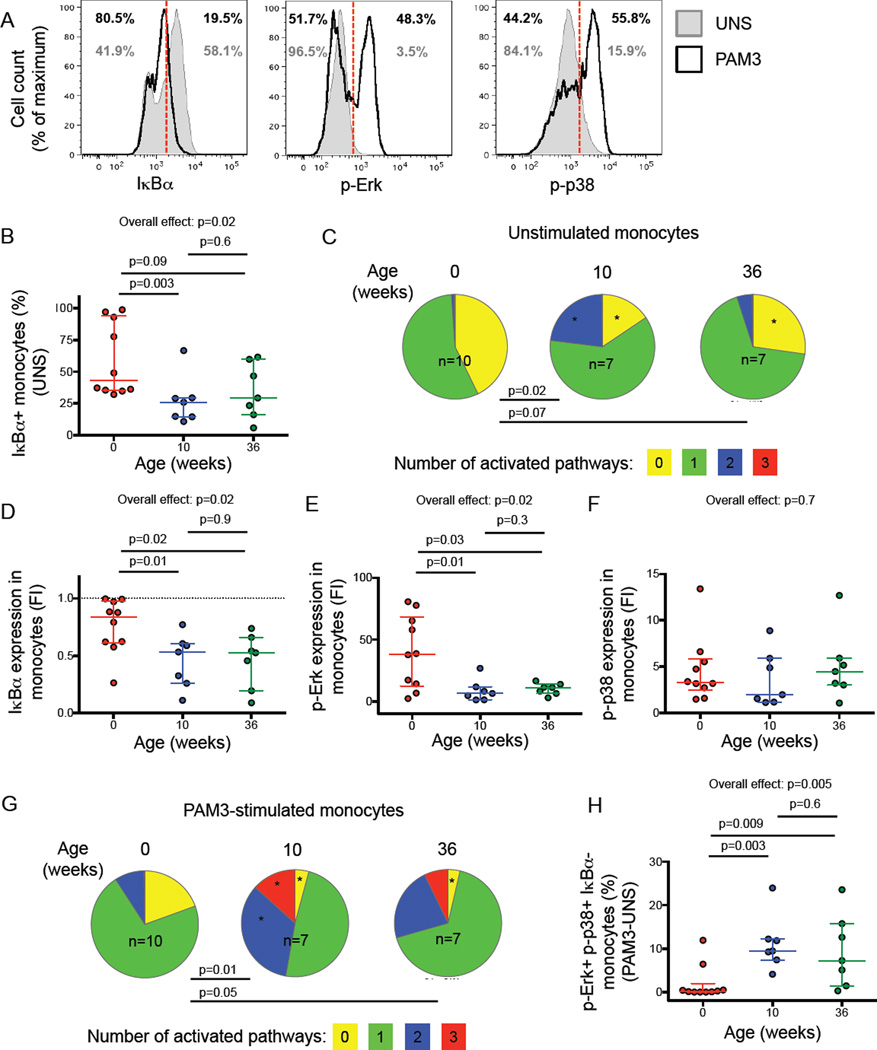
Newborns and young infants are particularly susceptible to infections, including Mycobacterium tuberculosis. Further, immunogenicity of vaccines against tuberculosis and other infectious diseases appears suboptimal early in life compared with later in life. We hypothesized that developmental changes in innate immunity would underlie these observations. To determine the evolution of innate responses to mycobacteria early in life, whole blood or PBMC from newborns, as well as 10- and 36-wk-old infants, was incubated with viable Mycobacterium bovis bacillus Calmette-Guérin or TLR ligands. Innate cell expression of cytokines and maturation markers was assessed, as well as activation of the proinflammatory NF-κB- and MAPK-signaling pathways. Bacillus Calmette-Guérin-induced production of the proinflammatory cytokines TNF-α, IL-6, and IL-12p40 increased from the newborn period to 9 mo of age in monocytes but not in myeloid dendritic cells. No changes in production of anti-inflammatory IL-10 were observed. CD40 expression increased with age in both cell populations. Older infants displayed substantial activation of all three signal transduction molecules: degradation of NF-κB inhibitor IκBα and phosphorylation of MAPK Erk and p38 upon TLR1/2 triggering, compared with predominant activation of only one of any of these molecules in newborns. Maturation of innate proinflammatory responses during the first 9 mo of life may underlie more effective control of mycobacteria and other pathogens observed later in infancy and age-related differential induction of Th1 responses by vaccination.


Conflict of interest statement

Conflict of interest: The authors declare that they have no commercial or financial conflicts of interest.

Figures

Figure 1
Figure 1. Monocyte expression of pro-inflammatory cytokines upon BCG stimulation of whole blood from newborns and infants
(A) Monocyte expression of TNF-α, IL-6 and/or IL-12 from a representative infant at 36 weeks of age. Frequencies (%) of cells falling into each gate are shown for each plot. (B) Frequencies of monocyte subsets co-expressing pro-inflammatory cytokines upon BCG stimulation of whole blood from newborns, 10 and 36-week old infants (n = 25 for each group). (C) Frequencies of BCG-stimulated monocytes expressing all 3 pro-inflammatory cytokines (polyfunctional), any 2 of the 3 cytokines (bifunctional) or any 1 of the 3 cytokines (monofunctional). (D) Integrated median fluorescence intensity (iMFI) of BCG-induced TNF-α, IL-6 and IL-12 expression by monocytes, representing the product of the frequency and the MFI of cytokine+ monocytes, from newborns, 10 and 36-week old infants. For box and whisker plots, horizontal lines represent the median, boxes represent the interquartile range (IQR) and whiskers represent the range. Group comparisons were done using the Kruskal-Wallis test (Overall effect), followed by the Mann-Whitney test.
Figure 2
Figure 2. Myeloid DC expression of pro-inflammatory cytokines upon BCG stimulation of whole blood from newborns and infants
(A) mDC expression of TNF-α, IL-6 and/or IL-12 from a representative infant at 36 weeks of age. Frequencies of cells falling into each gate are shown for each plot. (B) Frequencies of mDCs expressing IL-12 in unstimulated (Nil), BCG- or LPS-stimulated whole blood from 36 week old infants (n = 25 for each group). (C) Frequencies of BCG-stimulated mDCs expressing any combination of TNF-α, IL-6 and/or IL-12. In scatter plots, horizontal lines represent the median and whiskers represent the interquartile range (IQR). Intra-group comparisons were done using the Wilcoxon test, while inter-group comparisons were done using the Kruskal-Wallis test (Overall effect).
Figure 3
Figure 3. Levels of soluble pro-inflammatory cytokines in plasma of whole blood from newborns and infants
Levels of soluble TNF-α, IL-6, and IL-12/p40 after incubation of cord or peripheral blood from newborns, 10 or 36-week old infants (n = 25 for each group) with BCG (A) and PAM3 (B). In scatter plots, horizontal lines represent the median and whiskers represent the interquartile range (IQR). Group comparisons were done using the Kruskal-Wallis test (Overall effect), followed by the Mann-Whitney test.
Figure 4
Figure 4. Innate cell expression of IL-10 upon stimulation of whole blood from newborns and infants
(A) Monocyte and mDC expression of IL-10 in whole blood from a 36-week old infant, stimulated with media (Nil), BCG or LPS. (B) Frequencies of cells falling into the IL-10 gate are shown for each participant. (C) Integrated median fluorescence intensity (iMFI) of BCG-induced IL-10 expression by monocytes or mDCs, representing the product of the frequency and the MFI of IL-10+ cells, from newborns, 10 and 36-week old infants (n = 25 for each group). (D) Levels of soluble IL-10 after incubation of cord or peripheral blood from newborns, 10 or 36-week old infants with BCG, PAM3 and LPS. For box and whisker plots, horizontal lines represent the median, boxes represent the interquartile range (IQR) and whiskers represent the range. Intra-group comparisons were done using the Wilcoxon test, while inter-group comparisons were done using the Kruskal-Wallis test (Overall effect), followed by the Mann-Whitney test.
Figure 5
Figure 5. Expression of maturation markers by monocytes and mDCs upon BCG stimulation of whole blood from newborns and infants
(A) CD40 expression on monocytes (left) or mDCs (right) after incubation of whole blood from a representative 36-week old infant for 18 hours with BCG (Blue line), LPS (Green line) or media (Red line). Median levels of CD40 expression by monocytes (B) or mDCs (C) in whole blood from newborns, 10 and 36-week old infants (n=24 for newborns; n=25 for 10- and 36-week old infants). Background expression of CD40 in mDC, p=0.7 for Newborn compared with infants at 10 weeks; p=0.0014 for newborns compared with infants at 36weeks; p= 0.0079 for infants at 10 weeks compared with 36 weeks. Background expression of CD40 in monocytes, p=0.0006 for Newborns compared with infants at 10 weeks; p<0.0001 for newborns compared with infants at 36weeks; p= 0.0016 for infants at 10 weeks compared with 36 weeks. Median levels of CD83 (D) or CD86 (E) expression by mDCs in blood from newborns, 10 and 36-week old infants stimulated for 18 hours with BCG (Blue triangles), LPS (Green squares) or media (Red squares). Error bars represent the IQR. The Mann-Whitney test was used for statistical comparisons.
Figure 6
Figure 6. Phagocytosis of BCG-GFP by mDCs and monocytes
(A). GFP fluorescence of monocytes and mDCs after 6 hour incubation of whole blood from a representative 36-week old infant with 3.5 × 10⁵ CFU/mL of GFP-expressing BCG. Proportions of BCG-GFP+ monocytes (B) and mDCs (C) in blood from newborns, 10 and 36-week old infants after 6 hours of incubation (n=24 for newborns; n=25 for 10- and 36-week old infants). In scatter plots, horizontal lines represent the median and whiskers represent the interquartile range (IQR). Group comparisons were done using the Kruskal-Wallis test (Overall effect), followed by the Mann-Whitney test.
Figure 7
Figure 7. Differential pro-inflammatory cell signaling in monocytes from newborns and older infants
Degradation of IκBα and phosphorylation of Erk (p-Erk) and p38 (p-p38) were measured by flow cytometry (gating strategy is shown in Supplementary figure 3A and 3B) in monocytes from newborns (n=10), 10-week-old (n=7) and 36-week-old (n=7) infants. (A) Representative IκBα, p-Erk and p-p38 staining in unstimulated (solid grey histograms) and PAM3 stimulated (open black histograms) monocytes from a single 36-week old infant. (B) Basal expression of IαBα in unstimulated monocytes. (C) Simultaneous activation of pro-inflammatory signaling pathways in unstimulated monocytes from infants at different ages. Pie charts represent the total monocyte population. Slices of each pie show the median proportion of monocytes exhibiting simultaneous activation of 3 (red), any 2 (blue), one (green) or no (yellow) signaling pathways (i.e. IκBα degradation, phosphorylation of Erk or p38). (D–F) Proportions of monocytes expressing IκBα (D), p-Erk (E) and p-p38 (F) after PAM3 stimulation, expressed as fold induction (FI) over marker+ monocyte proportions in unstimulated samples. (G) Simultaneous activation of pro-inflammatory signaling pathways in PAM3-stimulated monocytes from infants at different ages, represented as in (C). (H) Relative increase (stimulated minus unstimulated) in proportions of monocytes with simultaneous activation of the three signaling pathways in response to PAM3 at different ages. In scatter plots, horizontal lines represent the median and whiskers represent the interquartile range (IQR). Group comparisons were done using the Kruskal-Wallis test (overall effect), followed by the Mann-Whitney test for pairwise comparisons. Pies and slices were compared using permutation test (p values are shown) or T-test (stars indicate p<0.05 in comparison to newborns), respectively.

References

    1. Kleinnijenhuis J, Oosting MB, Joosten LAB, Netea MG, van Crevel R. Innate Immune Recognition of Mycobacterium tuberculosis. Clinical and Developmental Immunology. 2011;2011:1–12. - PMC - PubMed
    1. Kawai T, Akira S. The role of pattern-recognition receptors in innate immunity: update on Toll-like receptors. Nature Publishing Group. 2010;11:373–384. - PubMed
    1. Kawai T, Akira S. Signaling to NF-κB by Toll-like receptors. Trends in Molecular Medicine. 2007;13:460–469. - PubMed
    1. Schorey JS, Cooper AM. Macrophage signalling upon mycobacterial infection: the MAP kinases lead the way. Cell Microbiol. 2003;5:133–142. - PubMed
    1. Blumenthal A, Ehlers S, Ernst M, Flad H-D, Reiling N. Control of mycobacterial replication in human macrophages: roles of extracellular signal-regulated kinases 1 and 2 and p38 mitogen-activated protein kinase pathways. Infection and Immunity. 2002;70:4961–4967. - PMC - PubMed

Publication types