. 2014 Apr 29;111(17):6479-84.
doi: 10.1073/pnas.1321576111. Epub 2014 Apr 14.

Gq/5-HT2c receptor signals activate a local GABAergic inhibitory feedback circuit to modulate serotonergic firing and anxiety in mice

Affiliations

Gq/5-HT2c receptor signals activate a local GABAergic inhibitory feedback circuit to modulate serotonergic firing and anxiety in mice

Katharina Spoida et al. Proc Natl Acad Sci U S A. .

Abstract

Serotonin 2c receptors (5-HT2c-Rs) are drug targets for certain mental disorders, including schizophrenia, depression, and anxiety. 5-HT2c-Rs are expressed throughout the brain, making it difficult to link behavioral changes to circuit specific receptor expression. Various 5-HT-Rs, including 5-HT2c-Rs, are found in the dorsal raphe nucleus (DRN); however, the function of 5-HT2c-Rs and their influence on the serotonergic signals mediating mood disorders remain unclear. To investigate the role of 5-HT2c-Rs in the DRN in mice, we developed a melanopsin-based optogenetic probe for activation of Gq signals in cellular domains, where 5-HT2c-Rs are localized. Our results demonstrate that precise temporal control of Gq signals in 5-HT2c-R domains in GABAergic neurons upstream of 5-HT neurons provides negative feedback regulation of serotonergic firing to modulate anxiety-like behavior in mice.


Conflict of interest statement

The authors declare no conflict of interest.

Figures

Fig. 1.
Fig. 1.
Light-induced changes in intracellular Ca2+ levels by Gq-coupled, C-terminally tagged vertebrate melanopsin. (A–C) (Upper) Schematic representation of the GPCRs in AAV expression vectors used in the experiments (Left) and corresponding predicted structure of the GPCRs (Right). Calcium responses were measured with a microplate reader using the fluorescent calcium indicator dye Fluo-4. Fluorescent counts were normalized to minimum fluorescence signal. Data from a representative experiment are shown as mean ± SEM from six wells. (Lower) Representative photomicrographs (Left) and quantification of Ca2+ responses (Right) of (A) heterologous expression of the WT 5-HT2c-R C-terminally tagged with eGFP in HEK cells and Ca2+ responses induced with 10 µM RO 60-0175 (arrowhead) in untransfected HEK cells (white diamonds) and those expressing 5-HT2c-eGFP (black circles) after 30-s baseline measurements (n = 6); (B) heterologous expression of vMo C-terminally tagged with mCherry in HEK cells and Ca2+ responses in HEK cells transiently expressing vMo, supplemented with 10 µM 9-cis retinal (white circles; n = 6), all-trans retinal (black triangles; n = 6) and without supplementation (black circles; n = 6) after repeated light stimulation (2-s light pulse, 1-s delay, 60 repeats), with HEK cells transfected with mCherry as control (white diamonds; n = 6); and (C) heterologous expression of vMo-CT5-HT2c C-terminally tagged with mCherry fused to the C-terminal domain of the human 5-HT2c-R in HEK cells and Ca2+ responses in HEK cells transiently expressing vMo-CT5-HT2c, supplemented with 10 µM 9-cis retinal (white circles; n = 6), all-trans retinal (black triangles; n = 6) and without any supplements (black circles; n = 6) after repeated light stimulation (2-s light pulse, 1-s delay, 60 repeats; 485 nm) with HEK cells transfected with mCherry (white diamonds; n = 6) as a control. (Scale bars: 15 µm.)
Fig. 2.
Fig. 2.
5-HT2c receptors are localized in GABAergic neurons in the DRN and modulate GABAergic and serotonergic neuronal firing. (A–C) Distribution of 5-HT2cRs in the DRN. (A) (Left) Representative photomicrographs displaying immunoreactivity (IR) for the 5-HT2cR (green) and TPH (red) in the DRN. (Center) Overlay of 5-HT2cR-IR and TPH-IR demonstrating no colocalization of 5-HT2cR on serotonergic cells. (Right) Higher-magnification view of the boxed region in the center panel. (B) (Left) Distribution of GAD65 (green) and TPH-IR (red) in the DRN. (Center) Overlay of GAD65 and TPH-IR. (Right) Higher-magnification view of the boxed region in the center panel. (C) (Left) Photomicrographs of the DRN displaying colocalization for the 5-HT2cR–positive and GAD65-positive cells. (Center) Overlay image of cells containing IR for both 5-HT2cR (green) and GAD65 (red), which appear yellow. (Right) Higher-magnification image of the boxed areas. Arrows indicate cells double-labeled for 5-HT2cR and GAD65. (Scale bars: 200 µm in A and B, Left and Center; 100 µm in B, Right ; 50 µm in C, Left and Center; 25 µm in C, Right.) (D–I) Activation of 5-HT2cRs in the DRN leads to either activation or inhibition of DRN neurons representing GABAergic and serotonergic neurons, respectively. (D) (Left) Example trace of repetitive activation of in vivo neuronal firing of GABAergic neurons in the DRN by application of 5-HT (Upper) or the 5-HT2c-R agonist RO 60-0175 (Lower) in anesthetized mice. (Right) Raster plot (Upper) and PSTH (Lower) during drug application to DRN neurons. The raster plot exemplifies a single cell response during five drug applications, whereas the PSTH shows the averaged single cell response during these five repetitions (1-s bin width). (E) Average firing rate of DRN neurons before, during, and after application of 5-HT (red; n = 25), RO 60-0175 (green; n = 25) or saline (gray; n = 6). (F) Normalized firing rates of DRN neurons for the data shown in E. (G) (Left) Example trace of repetitive inhibition of in vivo neuronal firing of serotonergic neurons in the DRN by the application of 5-HT (Upper) or RO 60-0175 (Lower) in anesthetized mice. (Right) Raster plot (Upper) and PSTH (Lower) during drug application to DRN neurons. The raster plot exemplifies a single cell response during six drug applications, whereas the PSTH shows the averaged single cell response during these six repetitions (1-s bin width). (H) Average firing rate of DRN neurons before, during, and after application of 5-HT (red; n = 13), RO 60-0175 (green; n = 10), or saline (gray; n = 6). (I) Normalized firing rates of DRN neurons for the data shown in E.
Fig. 3.
Fig. 3.
vMo-CT5-HT2c colocalizes with 5-HT2c-Rs in dorsal raphe GABAergic neurons and repetitively modulates neuronal firing after light-activation. (A) AAV expression vector carrying inverted vMo-CT5-HT2c (AAV-DIO-vMo-CT5-HT2c) under the control of EF-1α promoter for cre-dependent expression in dorsal raphe GABAergic cells. ITR, inverted terminal repeat; WPRE, woodchuck hepatitis B virus posttranscriptional element. (B and C) vMo-CT5-HT2c is expressed in GABAergic neurons and colocalizes with endogenous 5-HT2c-Rs. (B) (Upper Left) GAD65 immunostaining (green) indicating tissue-specific expression of vMo-CT5-HT2c (red) on dorsal raphe GABAergic cells. (Upper Right) Overlay of GAD65 and vMo-CT5-HT2c. (Lower) Higher-magnification images of individual cells and example cell marked with arrowheads in the overlay. (C) Endogenous 5-HT2c-Rs (green) colocalizing with vMo-CT5-HT2c (red) in dorsal raphe GABAergic cells. White arrows indicate colocalization between native HT2c-Rs and vMo-CT5-HT2c in exemplary cells. (Scale bars: 100 µm in B, Upper and C; 50 µm in B, Lower Center; 30 µm in B, Lower Left and Right.) (D) Single trace from in vivo optrode recordings from dorsal raphe serotonergic cells with light stimulation (blue bar; 10 s) of vMo-CT5-HT2c. (E) PSTH (1-s bins) and raster plot of three sweeps. (F) Changes in DR 5-HT firing rate before (pre), during (light), and after (post) light stimulation for control (AAV-eGFP: n = 5 cells from one animal; black triangles) and vMo-CT5-HT2c (n = 12 cells from three animals; white circles). Numerical data are provided in the text. (G) Normalized firing rate for recorded 5-HT cells. Light activation of dorsal raphe GABAergic cells significantly decreased 5-HT cell firing compared with control recordings. Numerical data are provided in the text.
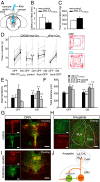
Fig. 4.
Fig. 4.
Light activation of vMo-CT5-HT2c specifically in GABAergic neurons relieves anxiety behavior through inhibition of serotonergic neurons. (AC) NSF. (A) Stereotactic targeting of the DRN through a cannula guide in vivo. (B) Constant illumination with blue light significantly decreased latency to feed in a novel environment. Control group (white), n = 4 animals; vMo-CT5-HT2c group (black), n = 5 animals. (C) Food consumption during NSF was not altered in both groups. (D–F) OFT. (D) Comparison of center time duration in the OFT without light stimulation (OFF) and with light stimulation (ON). Individual traces (light gray) and mean center time duration (black) for GAD65-Ires-Cre mice injected with AAV-DIO-vMo-CT5-HT2c (n = 10 animals), AAV-eGFP (n = 7 animals), or AAV-flex-Arch-GFP (n = 7 animals) and ePet1-Cre mice injected with AAV-flex-Arch-GFP (n = 5 animals). Numerical data are provided in the text. (Right) Exemplary paths demonstrating increased center time in the OFT during light-on epochs for a vMo-CT5-HT2c–injected animal. (E and F) Border-to-center transitions and total distance traveled in the OFT for control (white; n = 7 animals), vMo-CT5-HT2c in GAD65-Ires-Cre–expressing mice (black; n = 10 animals), Arch-GFP in GAD65-Cre–expressing mice (dark gray; n = 7 animals), and Arch-GFP in ePet1-Cre–expressing mice (light gray; n = 5 animals) without (OFF) and with (ON) constant blue light stimulation. (G–I) DRN serotonergic projections into the amygdala. Serotonergic projection sites in ePet1-Cre transgenic mice were analyzed using AAV2/1.CAG.FLEX.tdTomato.WPRE. bGH tracer virus. (G and I) tdTomato expression (red) at two distinct dorsal raphe sites (rostral and midrostrocaudal). Colabeling for TPH (green) shows restricted expression in 5-HT containing cells (yellow). (H) tdTomato expression of 5-HT containing nerve terminals in the amygdala (red) of an ePet1-Cre transgenic mouse colabeled with fluorescent Nissl (green). The overlay shows 5-HT innervation sites in the basolateral amygdala (BLA) and central amygdala (CeA); boundaries are outlined by dashed lines. (J) Schematic representation of a purposed dorsal raphe–amygdala circuit comprising 5-HT2c-Rs to control anxious behavior. LA, basolateral amygdaloid nucleus, CeL, central amygdaloid nucleus, lateral devision, CeM, central amygdaloid nucleus, medial devision. (Scale bars: 200 µm in G–I.)

Similar articles

Cited by

References

    1. Lowry CA, Johnson PL, Hay-Schmidt A, Mikkelsen J, Shekhar A. Modulation of anxiety circuits by serotonergic systems. Stress. 2005;8(4):233–246. - PubMed
    1. Barnes NM, Sharp T. A review of central 5-HT receptors and their function. Neuropharmacology. 1999;38(8):1083–1152. - PubMed
    1. Millan MJ. Serotonin 5-HT2C receptors as a target for the treatment of depressive and anxious states: Focus on novel therapeutic strategies. Therapie. 2005;60(5):441–460. - PubMed
    1. Sharp T, Boothman L, Raley J, Quérée P. Important messages in the “post”: Recent discoveries in 5-HT neurone feedback control. Trends Pharmacol Sci. 2007;28(12):629–636. - PubMed
    1. Sanders-Bush E, Burris KD, Knoth K. Lysergic acid diethylamide and 2,5-dimethoxy-4-methylamphetamine are partial agonists at serotonin receptors linked to phosphoinositide hydrolysis. J Pharmacol Exp Ther. 1988;246(3):924–928. - PubMed

Publication types

MeSH terms