. 2014 Apr 29;111(17):E1768-76.
doi: 10.1073/pnas.1403138111. Epub 2014 Apr 14.

Evolutionary pathway to increased virulence and epidemic group A Streptococcus disease derived from 3,615 genome sequences

Affiliations

Evolutionary pathway to increased virulence and epidemic group A Streptococcus disease derived from 3,615 genome sequences

Waleed Nasser et al. Proc Natl Acad Sci U S A. .

Abstract

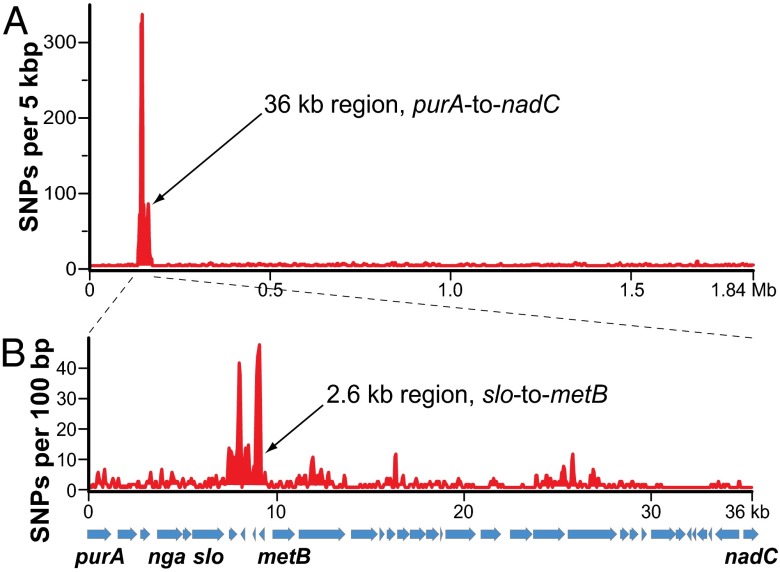
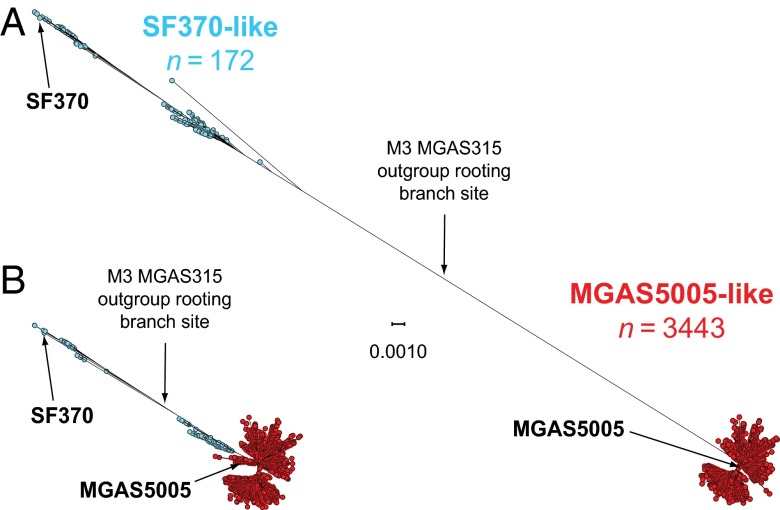
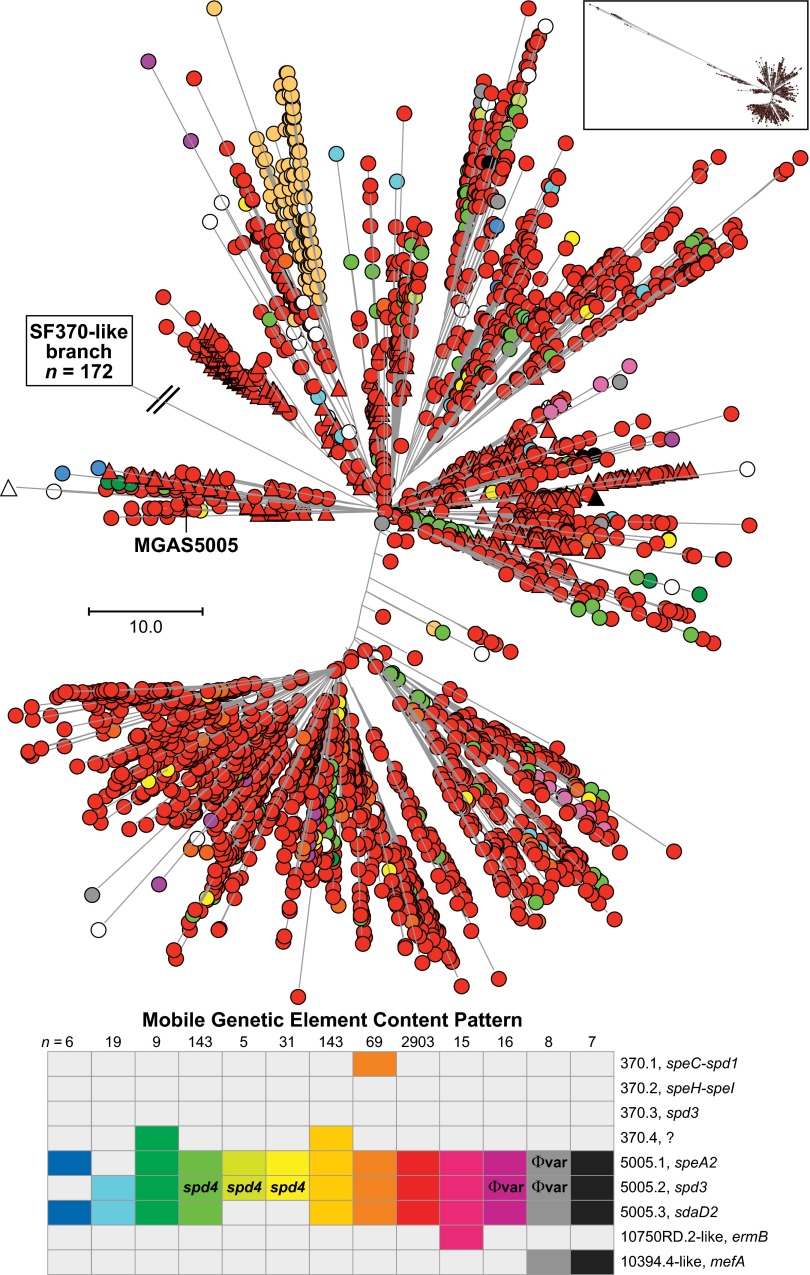
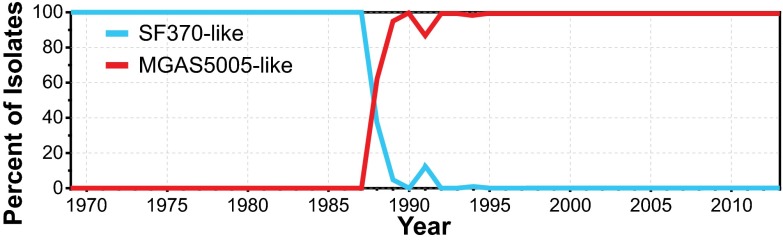
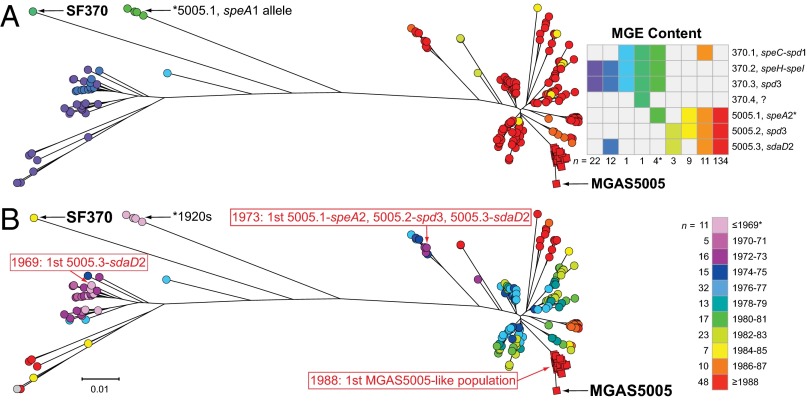
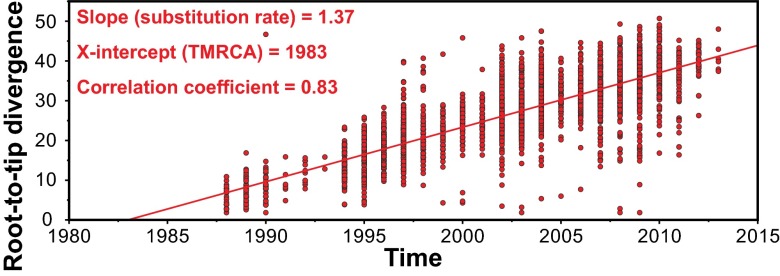
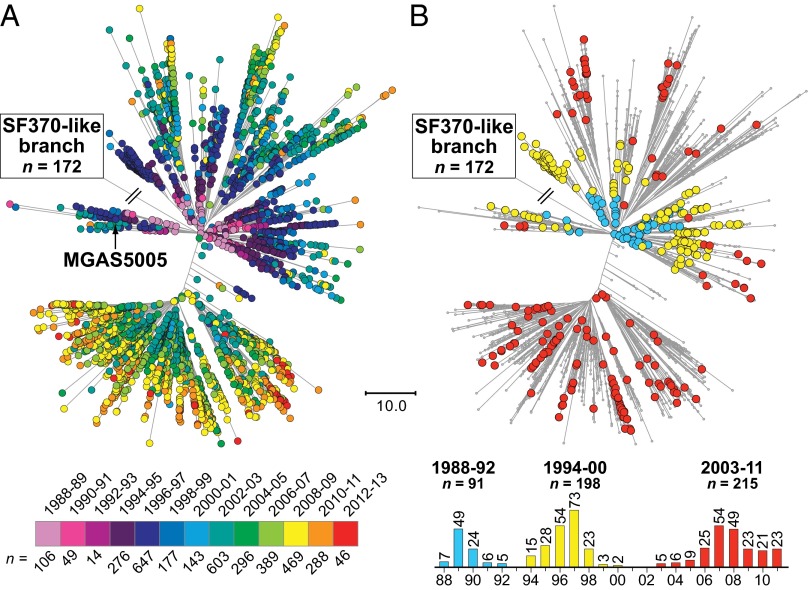
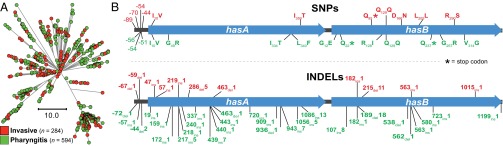
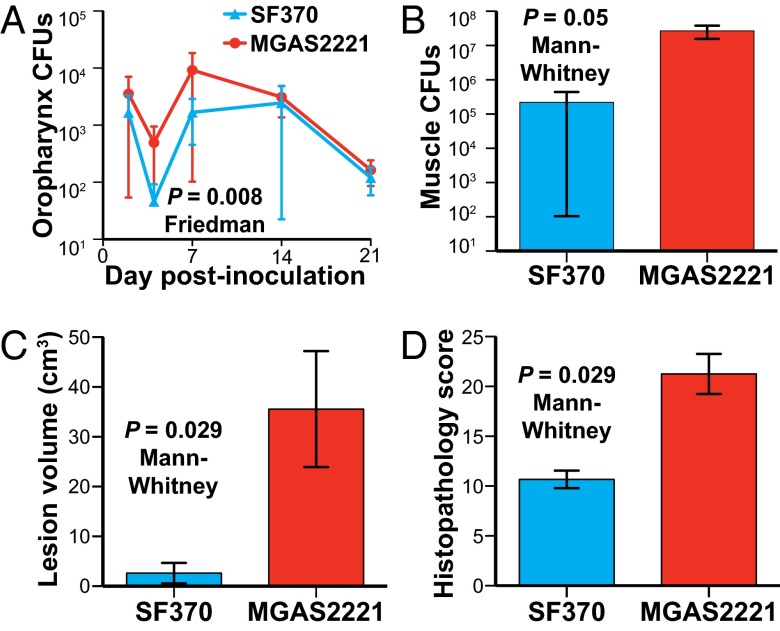
We sequenced the genomes of 3,615 strains of serotype Emm protein 1 (M1) group A Streptococcus to unravel the nature and timing of molecular events contributing to the emergence, dissemination, and genetic diversification of an unusually virulent clone that now causes epidemic human infections worldwide. We discovered that the contemporary epidemic clone emerged in stepwise fashion from a precursor cell that first contained the phage encoding an extracellular DNase virulence factor (streptococcal DNase D2, SdaD2) and subsequently acquired the phage encoding the SpeA1 variant of the streptococcal pyrogenic exotoxin A superantigen. The SpeA2 toxin variant evolved from SpeA1 by a single-nucleotide change in the M1 progenitor strain before acquisition by horizontal gene transfer of a large chromosomal region encoding secreted toxins NAD(+)-glycohydrolase and streptolysin O. Acquisition of this 36-kb region in the early 1980s into just one cell containing the phage-encoded sdaD2 and speA2 genes was the final major molecular event preceding the emergence and rapid intercontinental spread of the contemporary epidemic clone. Thus, we resolve a decades-old controversy about the type and sequence of genomic alterations that produced this explosive epidemic. Analysis of comprehensive, population-based contemporary invasive strains from seven countries identified strong patterns of temporal population structure. Compared with a preepidemic reference strain, the contemporary clone is significantly more virulent in nonhuman primate models of pharyngitis and necrotizing fasciitis. A key finding is that the molecular evolutionary events transpiring in just one bacterial cell ultimately have produced millions of human infections worldwide.

Keywords: flesh-eating disease; mobile genetic element; molecular clock; pathogenesis; phylogeography.


Conflict of interest statement

The authors declare no conflict of interest.

Figures

Fig. 1.
Fig. 1.
Comparison of SNP distribution in strain SF370 and strain MGAS5005. Polymorphisms between the SF370 and MGAS5005 genomes were identified using a combination of sequence alignment and polymorphism discovery tools: VAAL, MUMmer, and ClustalX. (A) Distribution of SNPs across the MGAS5005 genome. Plotted is the SNP density (y axis) in a 5-kb window iterated every 100 bp across the MGAS5005 genome (x-axis). The distribution of SNPs is nonrandom, with 576 (64.3%) of 896 SNPs occurring in the 36-kb region between the purA and nadC genes. (B) Distribution of SNPs across the MGAS5005 genome 36-kb region of recombination. Plotted is the SNP density in a 100-bp window iterated every 50 bp across the 36-kb region of recombination. The distribution of SNPs is nonrandom, with 286 (49.7%) of 586 SNPs occurring in the 2.6-kb sequence between the slo and metB genes.
Fig. 2.
Fig. 2.
Genetic relationships among the 3,615 serotype M1 strains. Genetic relationships among the strains were inferred by the method of neighbor joining, using SplitsTree. Strains with an SF370-like 36-kb purA-to-nadC region are shown in blue, and strains that are MGAS5005-like (i.e., strains that have a mosaic chromosome with a recombined M12-like purA-to-nadC region) are shown in red. (A) Genetic relationships inferred on the basis of all 13,221 core chromosomal SNPs identified among the 3,615 strains. Including SNPs within the 36-kb purA-to-nadC region, the SF370-like strains are genetically distinct from the MGAS5005-like strains. (B) Genetic relationships inferred based on the 12,355 core chromosomal SNPs that remain after exclusion of the horizontally acquired SNPs in the 36-kb purA-to-nadC region of recombination. Exclusion of the SNPs in the 36-kb region of recombination collapses the vast majority of the genetic distance between the older SF370-like progenitor strains and the contemporary MGAS5005-like descendant strains. Excluding SNPs in the 36-kb purA-to-nadC region and rooting the tree using GAS serotype M3 strain MGAS315 as an outgroup places SF370 and older SF370-like strains on one side of the tree (upper left), and most SF370-like strains from the ∼mid-1970s onward and all MGAS5005-like strains on the opposite side (lower right). Both trees are shown at the same scale.
Fig. 3.
Fig. 3.
MGE content of MGAS5005-like M1 strains. Shown is the phylogeny inferred by neighbor-joining for 3,443 MGAS5005-like contemporary M1 strains based on 12,355 concatenated core SNPs. SNPs located in the 36-kb region of recombination and the MGEs were excluded to constrain the inferred phylogeny to vertically inherited SNPs. Labeled is the branch leading to the tree root and SF370-like strains, which are not shown because of space constraints. Strains are colored by MGE content, as indicated in the bottom figure inset. There were 13 MGE content patterns found in 5 or more strains of the cohort. MGE patterns found in 4 or fewer strains are shown collectively as open circles/triangles (n = 69). The vast majority of the strains (84%) have the same MGE content as strain MGAS5005 (i.e., no difference in gene content was detected relative to MGAS5005). Invasive isolates are shown as circles, and pharyngitis isolates as triangles. Evident in the tree are numerous independent occurrences of MGE acquisition and loss, as well as commonality in MGE content among strains as a consequence of vertical inheritance. MGE content of the 172 SF370-like strains is shown in Fig. 5.
Fig. 4.
Fig. 4.
Temporal distribution of the SF370-like and MGAS5005-like M1 strains. Over the short period of only a few years (1987–1989), contemporary MGAS5005-like strains emerged rapidly and essentially displaced antecedent SF370-like M1 strains across a broad geographic region, if not globally.
Fig. 5.
Fig. 5.
Timing of molecular genetic events leading to the emergence of the contemporary MGAS5005-like M1 strains. Illustrated is the phylogeny of 198 strains based on 1,594 concatenated core SNPs inferred by neighbor-joining. SNPs located in the 36-kb region of recombination and the MGEs were excluded to constrain the inference to primarily vertically inherited SNPs. Shown as circles are all 172 strains with an SF370-like 36-kb region. Nearly all of these strains (n = 165) were isolated before 1989. Shown as squares are reference strain MGAS5005 isolated in 1996 and all strains with an MGAS5005-like 36-kb region isolated in 1988 (n = 25), the first year such strains are present in the study sample. (A) Prophage content is illustrated for each strain by color, as shown in the inset figure on the right. The majority of the strains (n = 134/198, 68%), including the majority (n = 50/81, 62%) of the SF370-like strains from the 1970s, have the same prophage content as strain MGAS5005. (B) Year of isolation for each strain is illustrated by color, as shown in the inset on the right. All isolates before 1988 have an SF370-like 36-kb region. Strains with an MGAS5005-like 36-kb region branch from a progenitor cluster of SF370-like strains that already contain the same prophage content as MGAS5005 (bottom right on the trees). Inspection of the trees shows that an SF370-spd3 or 5005.2-spd3-encoding prophage is present in all isolates going back to the 1920s; a 5005.3-sdaD2-encoding prophage is present in strains as early as 1969. Strains having the complete MGAS5005 complement of prophage, including the 5005.1-speA2 allele, are present as early as 1973. In contrast, the first strains with an MGAS5005-like 36 kb-region are not present in the comprehensive M1 population studied herein until 1988.
Fig. 6.
Fig. 6.
Estimation of 1983 as the year of origin of the contemporary MGAS5005-like M1 strains. Phylogeny among all 3,443 MGAS5005-like strains was inferred on the basis of 11,333 concatenated core SNPs by neighbor-joining. SNPs in the 36-kb region of recombination and in MGEs were excluded to constrain the inference to primarily vertically inherited SNPs. A chronogram (time-tree) with best-fit root was generated from the neighbor-joining tree and the year of isolation. Illustrated is a straight-line best fit of the root-to-tip divergence (i.e., the number of core SNPs between the individual strains and the best-fit root) for each of the strains. The good correlation coefficient (i.e., a value >0.8) indicates that the data fit very well, with the assumption of a uniform molecular clock. The slope of the line is the estimated evolutionary rate in SNPs per core genome (∼1.7 million nucleotide sites) per year. The X-intercept (1983) is the estimated time of origin of the most recent common ancestor.
Fig. 7.
Fig. 7.
Temporal structure of the M1 population. Illustrated is the phylogeny for all 3,443 MGAS5005-like strains inferred by neighbor-joining, based on 12,355 vertically inherited core SNPs. The branch point leading to the tree root and SF370-like strains is labeled. (A) Strains from all 9 geographic regions are color coded by year of isolation, as indicated in the lower inset. Evident on the branches is a correlation between increasing root-to-tip genetic distance and increasing year of isolation. (B) To further illustrate this finding, invasive isolates from Finland, collected as part of a prospective population-based surveillance program, are color coded according to the peaks of infection, as indicated in the epidemic curve shown in the lower inset.
Fig. 8.
Fig. 8.
SNPs and indels present in hasA and hasB in Finland invasive infection isolates and pharyngitis isolates. (A) Illustrated is the inferred phylogeny for all 878 contemporary MGAS5005-like Finland isolates collected between 1988 and 1998 based on 1,477 core SNPs by neighbor-joining. Invasive isolates are shown in red and pharyngitis in green. Invasive infection and pharyngitis isolates comingle in all branches of the phylogeny; they do not constitute separate, genetically distinct populations. (B) Diagrammed are the hasA and hasB GAS hyaluronic acid capsule synthesis genes and the adjacent upstream intergenic region. Polymorphisms found among all of the MGAS5005-like Finland invasive isolates (n = 504) are shown in red above the genes and among all of the pharyngitis isolates (n = 594) in green below the genes. The SNP distribution is illustrated in the upper panel, and the indel distribution in the lower panel. The predicted consequences of coding-region SNPs are indicated. After normalizing for the number of strains in each of the sets, polymorphisms in the pharyngitis isolates were found at 1.7 times the frequency they occurred in the invasive infection isolates.
Fig. 9.
Fig. 9.
Postresurgence strain MGAS2221 is significantly more virulent than SF370 in nonhuman primate models of pharyngitis and necrotizing fasciitis. (A) Cynomolgus macaques were inoculated in the upper respiratory tract, and mean cfus recovered from the oropharynx are shown with P value for Friedman test. (B–D) Cynomolgus macaques were inoculated intramuscularly in the anterior thigh. Cfus per gram of infected tissue, necrotizing fasciitis lesion volume, and histopathology score obtained at necropsy are shown. P values for the Mann–Whitney test are shown.

Comment in

References

    1. Beall B, Facklam R, Hoenes T, Schwartz B. Survey of emm gene sequences and T-antigen types from systemic Streptococcus pyogenes infection isolates collected in San Francisco, California; Atlanta, Georgia; and Connecticut in 1994 and 1995. J Clin Microbiol. 1997;35(5):1231–1235. - PMC - PubMed
    1. Bucher A, et al. Spectrum of disease in bacteraemic patients during a Streptococcus pyogenes serotype M-1 epidemic in Norway in 1988. Eur J Clin Microbiol Infect Dis. 1992;11(5):416–426. - PubMed
    1. Carapetis J, Robins-Browne R, Martin D, Shelby-James T, Hogg G. Increasing severity of invasive group A streptococcal disease in Australia: Clinical and molecular epidemiological features and identification of a new virulent M-nontypeable clone. Clin Infect Dis. 1995;21(5):1220–1227. - PubMed
    1. Carapetis JR, Steer AC, Mulholland EK, Weber M. The global burden of group A streptococcal diseases. Lancet Infect Dis. 2005;5(11):685–694. - PubMed
    1. Chelsom J, Halstensen A, Haga T, Høiby EA. Necrotising fasciitis due to group A streptococci in western Norway: Incidence and clinical features. Lancet. 1994;344(8930):1111–1115. - PubMed

Publication types

MeSH terms

Associated data