. 2014 Apr 29;111(17):E1806-14.
doi: 10.1073/pnas.1320421111. Epub 2014 Apr 14.

Control of vacuolar dynamics and regulation of stomatal aperture by tonoplast potassium uptake

Affiliations

Control of vacuolar dynamics and regulation of stomatal aperture by tonoplast potassium uptake

Zaida Andrés et al. Proc Natl Acad Sci U S A. .

Abstract

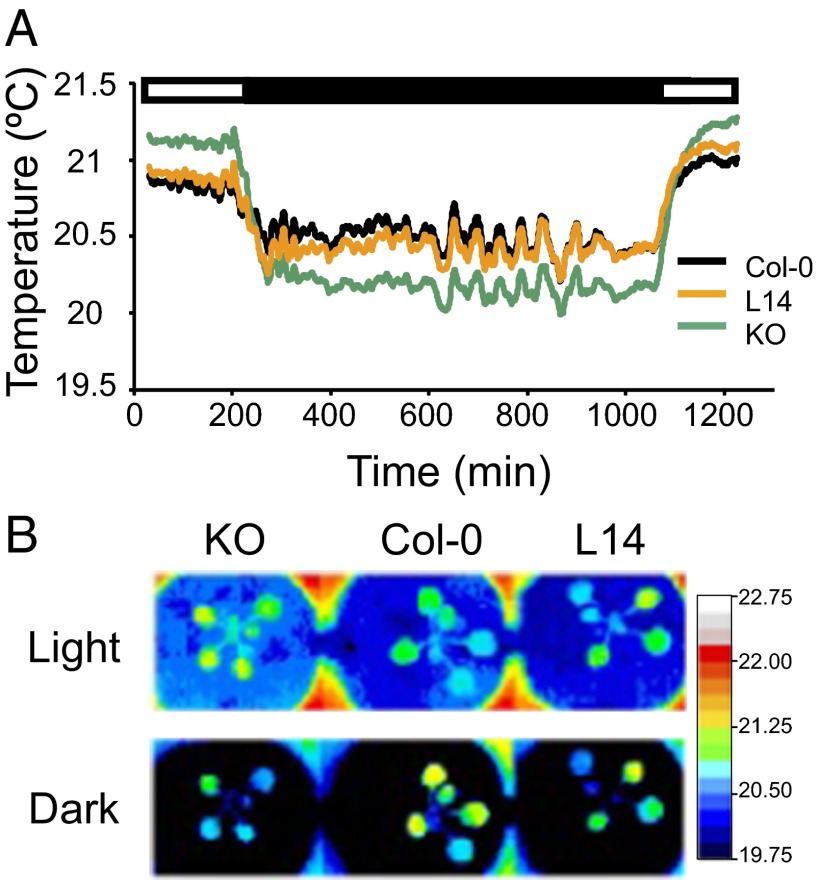
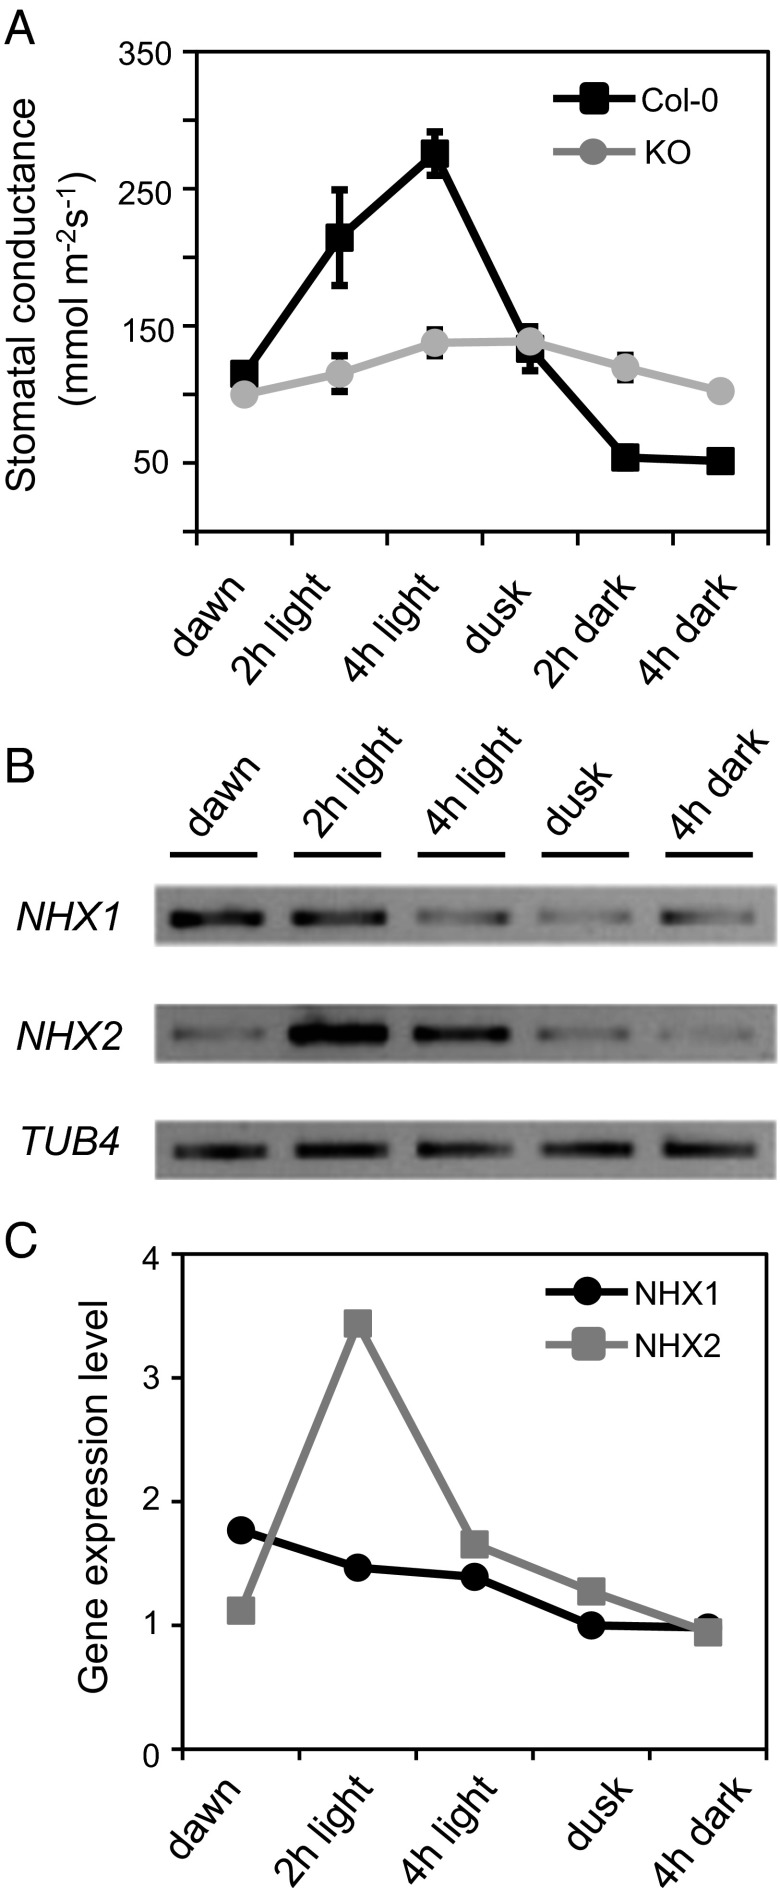
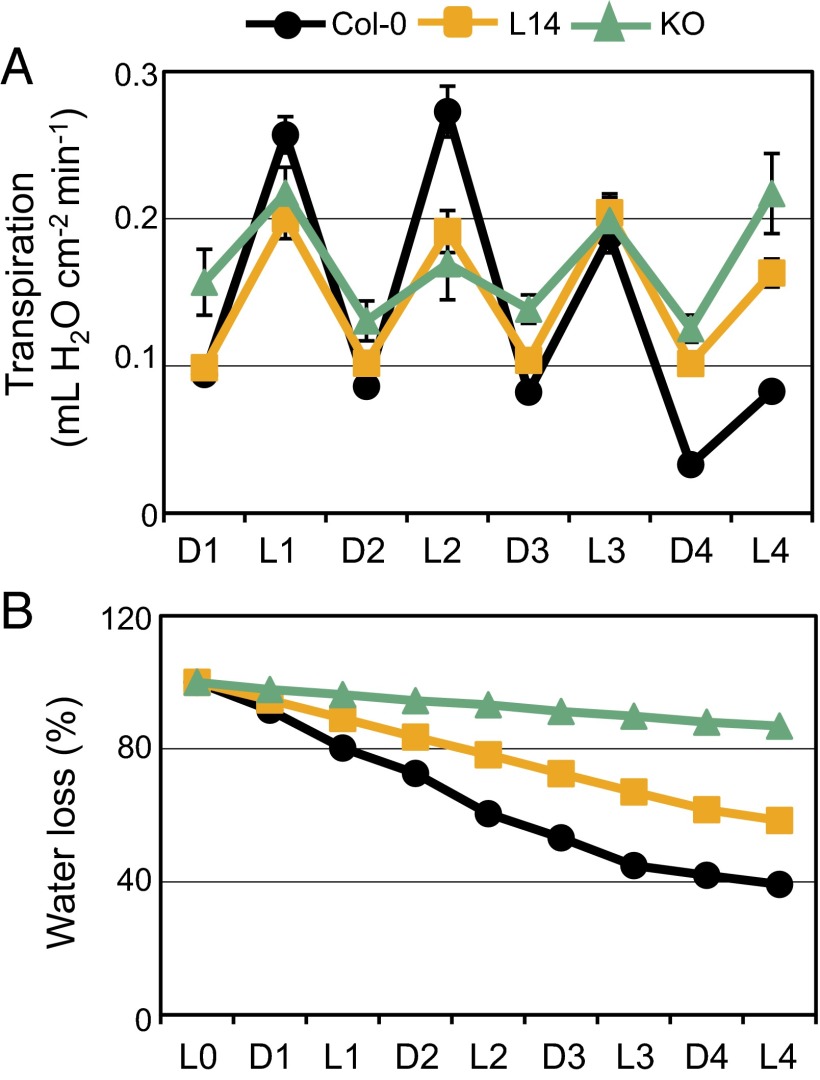
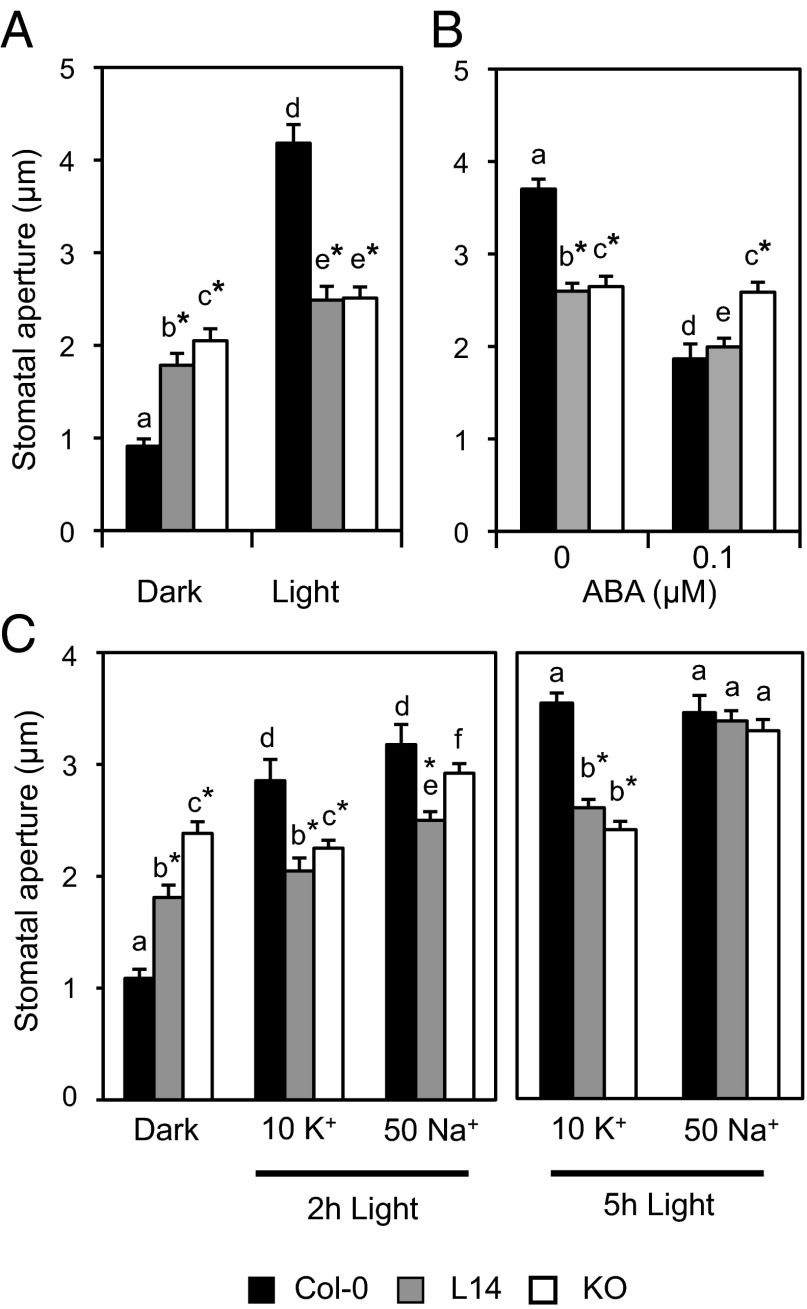
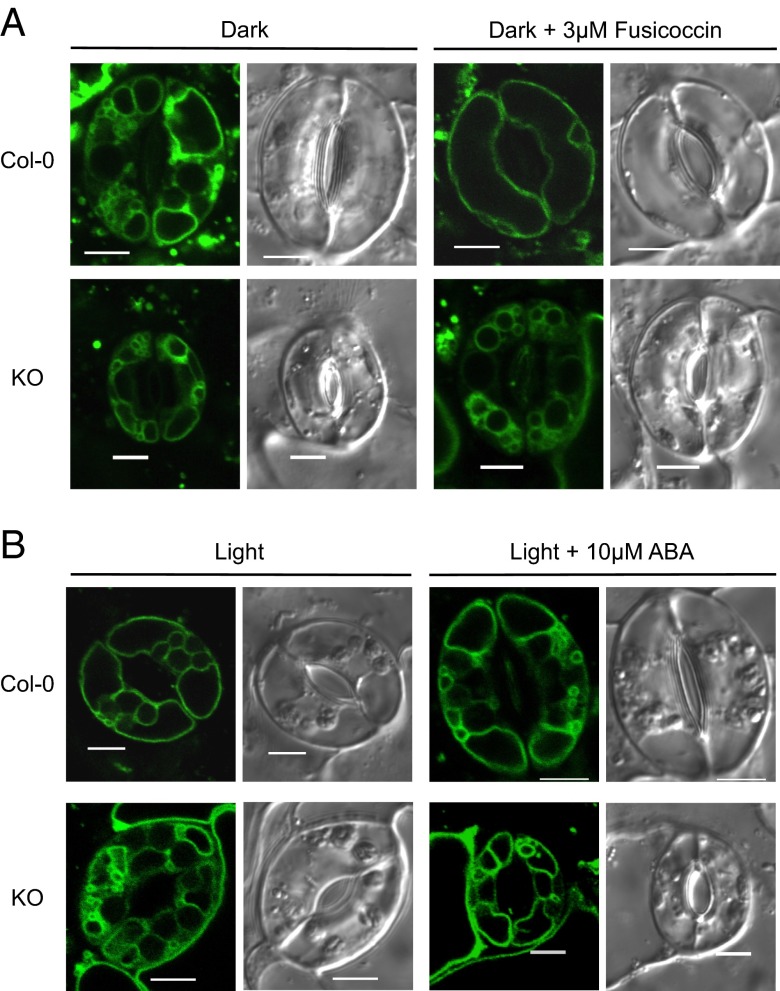
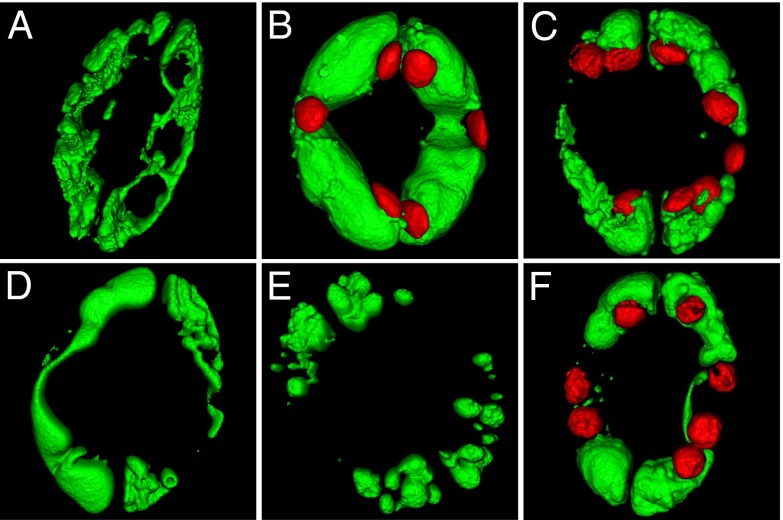
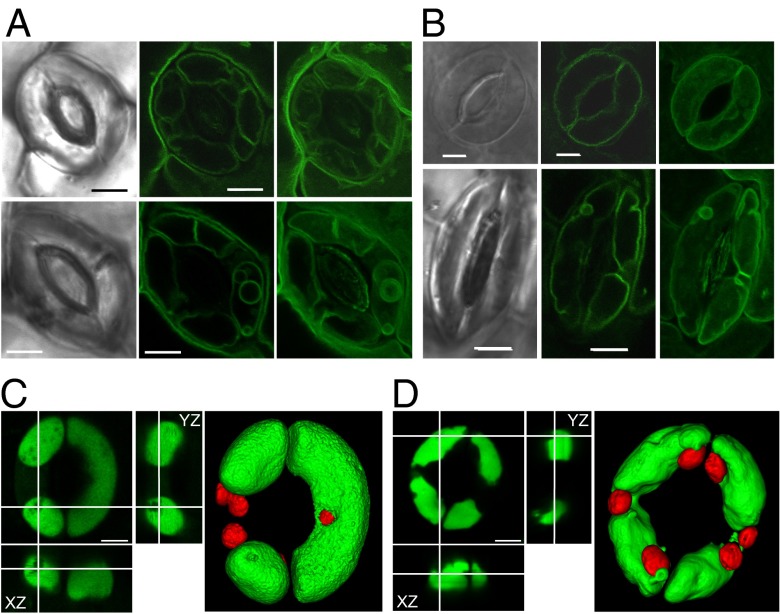
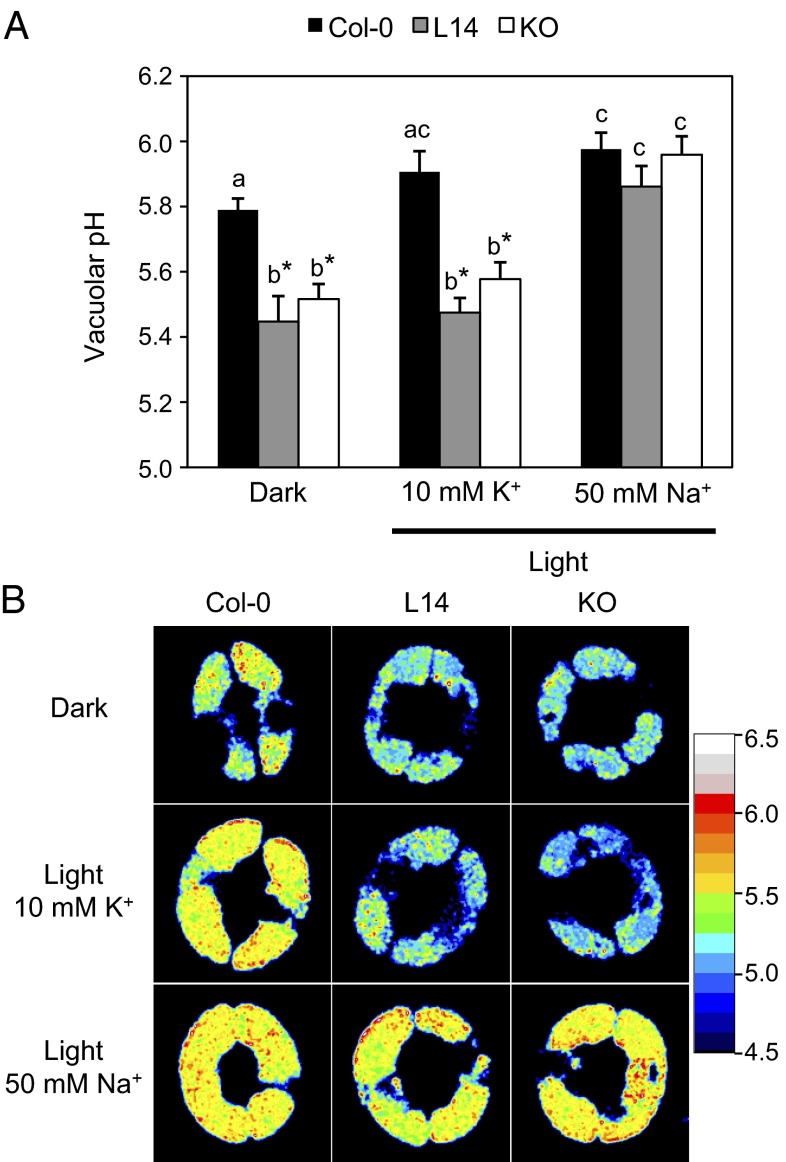
Stomatal movements rely on alterations in guard cell turgor. This requires massive K(+) bidirectional fluxes across the plasma and tonoplast membranes. Surprisingly, given their physiological importance, the transporters mediating the energetically uphill transport of K(+) into the vacuole remain to be identified. Here, we report that, in Arabidopsis guard cells, the tonoplast-localized K(+)/H(+) exchangers NHX1 and NHX2 are pivotal in the vacuolar accumulation of K(+) and that nhx1 nhx2 mutant lines are dysfunctional in stomatal regulation. Hypomorphic and complete-loss-of-function double mutants exhibited significantly impaired stomatal opening and closure responses. Disruption of K(+) accumulation in guard cells correlated with more acidic vacuoles and the disappearance of the highly dynamic remodelling of vacuolar structure associated with stomatal movements. Our results show that guard cell vacuolar accumulation of K(+) is a requirement for stomatal opening and a critical component in the overall K(+) homeostasis essential for stomatal closure, and suggest that vacuolar K(+) fluxes are also of decisive importance in the regulation of vacuolar dynamics and luminal pH that underlie stomatal movements.

Keywords: luminal pH control; stomata.


Conflict of interest statement

The authors declare no conflict of interest.

Figures

Fig. 1.
Fig. 1.
Thermal imaging suggests that stomata of nhx1 nhx2 mutants display abnormal behavior. (A) Data represent the average temperature of two leaves per plant from three different plants of Col-0, L14, and KO lines along light (white box) and dark (black box) periods at 1-min intervals. Error bars have been omitted for clarity; Table S1 shows statistical analysis. (B) Representative pseudocolored infrared images of leaf temperature of Col-0, L14, and KO lines at the light and dark periods.
Fig. 2.
Fig. 2.
Diurnal rhythms of stomatal conductance and NHX transcript abundance. (A) In planta stomatal conductance measurements in Col-0 and KO leaves at different time points of the day/night cycle. Dawn and dusk samples were collected 15 min before the light was switched on and off, respectively. Data represent mean and SE of three plants per line. Mean values were statistically different between WT and KO line (P < 0.05) in pairwise comparison at each time point by Tukey HSD test, except for values at the onset of light and at dusk. (B) RT-PCR analysis of NHX1 and NHX2 mRNA expression levels in whole leaves at different time points of the day/night cycle. The gene TB4 encoding β-tubulin-4 was used as loading control. (C) Relative NHX1 and NHX2 gene expression level at different time points of the day/night cycle calculated by densitometry analysis of the bands shown in B. Each point represents the mean of three different samples per line calculated after normalization to TB4. Arbitrary units of gene expression are relative to transcript abundance at 4 h of darkness.
Fig. 3.
Fig. 3.
Reduced water use of nhx1 nhx2 mutants. (A) Transpiration measurements of Col-0, L14, and KO plants during 4 d of drought stress. Pots were weighed twice daily, at the start of the dark period (marked as “D”) and at the onset of the light period (marked as “L”), and transpiration was calculated as the amount of water loss per area unit in each time interval (16 h dark/8 h light). Data represent the mean and SE of at least seven plants in individual pots per genotype. (B) Percentage of water loss along the drought assay in pots with Col-0, L14, and KO plants. Data represent mean and SE of at least seven plants per genotype. To quantify the background water evaporation from the soil, identical pots without plants were used as control.
Fig. 4.
Fig. 4.
Defective opening and closure of mutant stomata. (A) Light-induced stomatal opening. (B) ABA-induced stomatal closure. (C) Light-induced stomatal bioassays in the presence of 10 mM KCl or 50 mM NaCl. Data represent the mean and SE of the absolute values of aperture of at least 40 stomata per line and per treatment. Asterisks indicate statistically significant differences relative to WT for each treatment (P < 0.001) in pairwise comparison by Tukey HSD test. Letters indicate statistically significant differences between treatments for each line (P < 0.001) in pairwise comparison by Tukey HSD test.
Fig. 5.
Fig. 5.
Vacuolar morphology of guard cells during stomatal movements. (A) Vacuolar structure of Col-0 and KO guard cells visualized with TIP1;1:GFP after dark incubation for 2 h (Left) and 3 µM fusicoccin treatment for 2 h (Right). (B) Vacuolar structure of Col-0 and KO guard cells visualized with TIP1;1:GFP after illumination for 2 h (Left) and followed by 10 µM ABA treatment (Right). Bright-field (Right) and GFP images (Left) of TIP1;1:GFP. (Scale bar: 5 µm.)
Fig. 6.
Fig. 6.
Three-dimensional projections of vacuolar morphology. (A) Surface rendering of guard cells vacuoles loaded with the BCECF-AM in closed stomata of WT plant. (B) Vacuolar morphology in open stomata of WT. Autofluorescence signal of chloroplasts was also captured and is shown in red. (CF) Light-treated stomata of nhx1 nhx2 mutant plant. Chloroplasts are shown in red (C and F) or have been omitted (D and E).
Fig. 7.
Fig. 7.
Alleviation of vacuolar dysfunction by sodium. (A) Vacuolar structure of nhx1 nhx2 guard cells visualized with TIP1;1:GFP during stomatal opening. Pictures were taken after illumination for 2 h in the presence of 10 mM KCl (Upper) or 50 mM of NaCl (Lower). Bright-field (Left) and GFP images (Center) and 3D projection of z-axis images (Right) of TIP1;1:GFP. (Scale bar: 5 µm.) (B) Vacuolar structure in guard cells of the transgenic line expressing NHX2:GFP after illumination for 2 h (Upper) and after 2 h of incubation in darkness (Lower). The incubation buffer contained 10 mM KCl. Bright-field (Left) and GFP images (Center) and a 3D projection of z-axis images (Right) of NHX2:GFP. (Scale bar: 5 µm.) (C) Orthogonal views and 3D surface rendering of z-axis images of WT guard cell vacuoles loaded with 10 μM of BCECF-AM. Pictures were taken after illumination for 3 h in the presence of 50 mM of NaCl. (Scale bar: 5 µm.) (D) Orthogonal views and 3D surface rendering of z-axis images of the nhx1 nhx2 guard cell vacuoles loaded with 10 μM of BCECF-AM. Pictures were taken after illumination for 3 h in the presence of 50 mM of NaCl. (Scale bar: 5 µm.)
Fig. 8.
Fig. 8.
Acidification of pHv in mutant guard cells. (A) pHv measured after light-induced stomatal opening in the presence of 10 mM KCl or 50 mM NaCl in guard cells loaded with the pH-sensitive dye Oregon green. Data represent the mean and SE of pHv values of at least 20 stomata per line and per treatment. Asterisks indicate statistically significant differences relative to WT for each treatment (P < 0.001) in pairwise comparison by Tukey HSD test. Letters indicate statistically significant differences between treatments for each line (P < 0.001) in pairwise comparison by Tukey HSD test. (B) Representative ratiometric images of WT and nhx1 nhx2 mutant guard cells generated by dividing the emission images obtained in the 488-nm channel by those acquired in the 458-nm channel.

References

    1. Kim TH, Böhmer M, Hu H, Nishimura N, Schroeder JI. Guard cell signal transduction network: Advances in understanding abscisic acid, CO2, and Ca2+ signaling. Annu Rev Plant Biol. 2010;61:561–591. - PMC - PubMed
    1. Geiger D, et al. Activity of guard cell anion channel SLAC1 is controlled by drought-stress signaling kinase-phosphatase pair. Proc Natl Acad Sci USA. 2009;106(50):21425–21430. - PMC - PubMed
    1. Geiger D, et al. Guard cell anion channel SLAC1 is regulated by CDPK protein kinases with distinct Ca2+ affinities. Proc Natl Acad Sci USA. 2010;107(17):8023–8028. - PMC - PubMed
    1. Brandt B, et al. Reconstitution of abscisic acid activation of SLAC1 anion channel by CPK6 and OST1 kinases and branched ABI1 PP2C phosphatase action. Proc Natl Acad Sci USA. 2012;109(26):10593–10598. - PMC - PubMed
    1. Ye W, et al. Calcium-dependent protein kinase CPK6 positively functions in induction by yeast elicitor of stomatal closure and inhibition by yeast elicitor of light-induced stomatal opening in Arabidopsis. Plant Physiol. 2013;163(2):591–599. - PMC - PubMed

Publication types

MeSH terms

LinkOut - more resources