

Toward a better understanding and quantification of methane emissions from shale gas development
- PMID: 24733927
- PMCID: PMC4035982
- DOI: 10.1073/pnas.1316546111
Toward a better understanding and quantification of methane emissions from shale gas development
Abstract
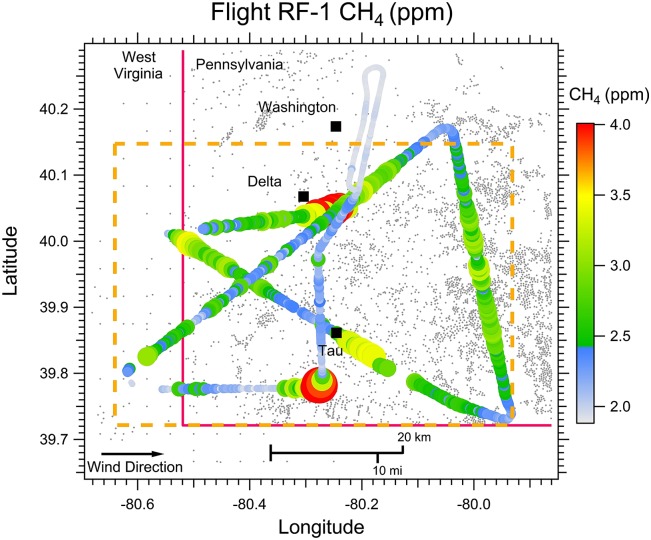
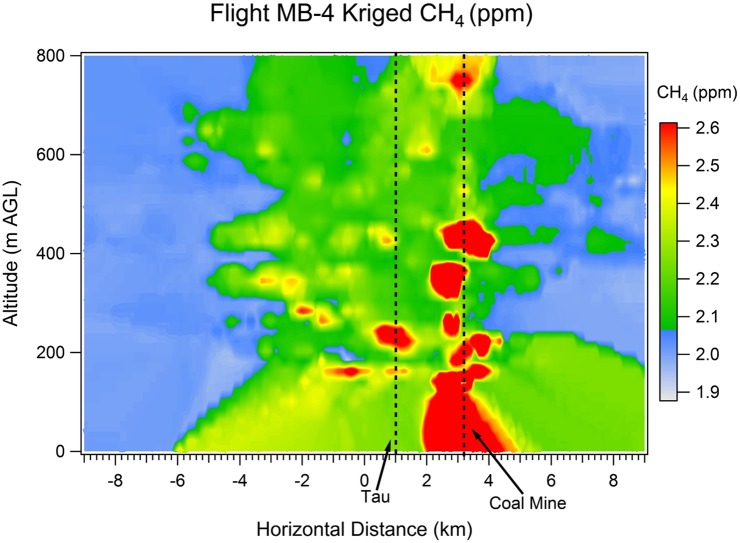
The identification and quantification of methane emissions from natural gas production has become increasingly important owing to the increase in the natural gas component of the energy sector. An instrumented aircraft platform was used to identify large sources of methane and quantify emission rates in southwestern PA in June 2012. A large regional flux, 2.0-14 g CH4 s(-1) km(-2), was quantified for a ∼ 2,800-km(2) area, which did not differ statistically from a bottom-up inventory, 2.3-4.6 g CH4 s(-1) km(-2). Large emissions averaging 34 g CH4/s per well were observed from seven well pads determined to be in the drilling phase, 2 to 3 orders of magnitude greater than US Environmental Protection Agency estimates for this operational phase. The emissions from these well pads, representing ∼ 1% of the total number of wells, account for 4-30% of the observed regional flux. More work is needed to determine all of the sources of methane emissions from natural gas production, to ascertain why these emissions occur and to evaluate their climate and atmospheric chemistry impacts.
Keywords: greenhouse gas; hydraulic fracturing; unconventional gas.
Conflict of interest statement
The authors declare no conflict of interest.
Figures

References
-
- Stocker T, et al. (2013) in Climate Change 2013: The Physical Science Basis: Technical Summary, eds Joussaume S, Penner J, Fredolin T (Cambridge University Press, New York), Table 8.7.
-
- Shindell DT, et al. Improved attribution of climate forcing to emissions. Science. 2009;326(5953):716–718. - PubMed
-
- Thompson AM. The oxidizing capacity of the Earth's atmosphere: Probable past and future changes. Science. 1992;356(5060):1157–1165. - PubMed
-
- Solomon S, et al. Contributions of stratospheric water vapor to decadal changes in the rate of global warming. Science. 2010;327(5970):1219–1223. - PubMed
-
- Frankenberg C, et al. Global column-averaged methane mixing ratios from 2003 to 2009 as derived from SCIAMACHY: Trends and variability. J Geophys Res. 2011;116(D4):D04302.
Publication types
LinkOut - more resources
Full Text Sources
Other Literature Sources
