. 2014 Apr 29;111(17):6377-82.
doi: 10.1073/pnas.1322420111. Epub 2014 Apr 14.

Stretched cell cycle model for proliferating lymphocytes

Affiliations

Stretched cell cycle model for proliferating lymphocytes

Mark R Dowling et al. Proc Natl Acad Sci U S A. .

Abstract

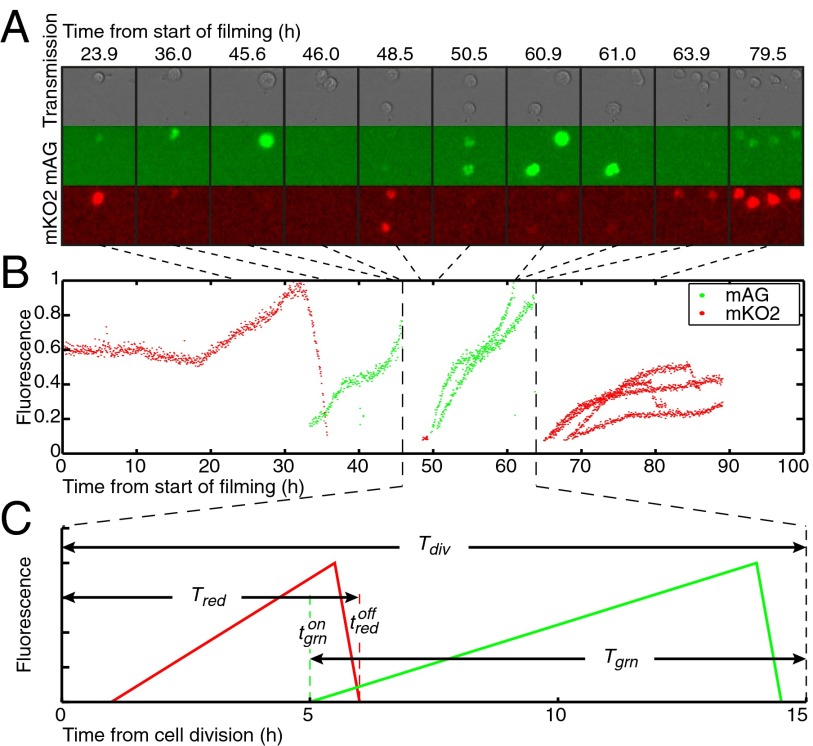
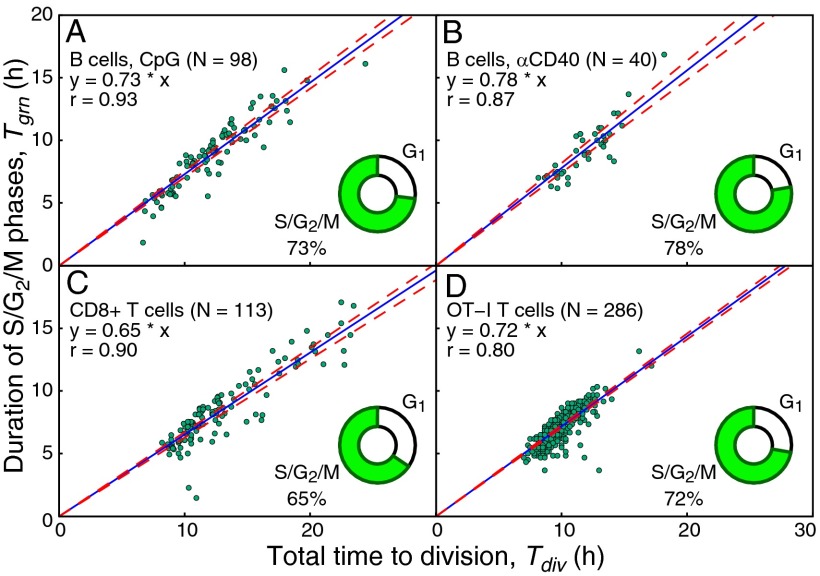
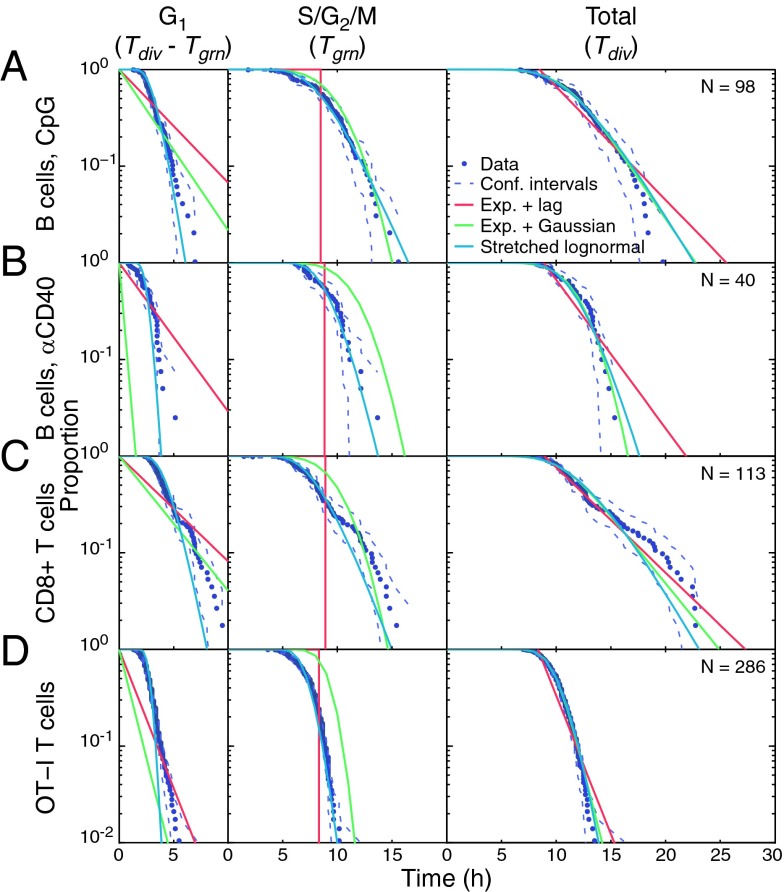
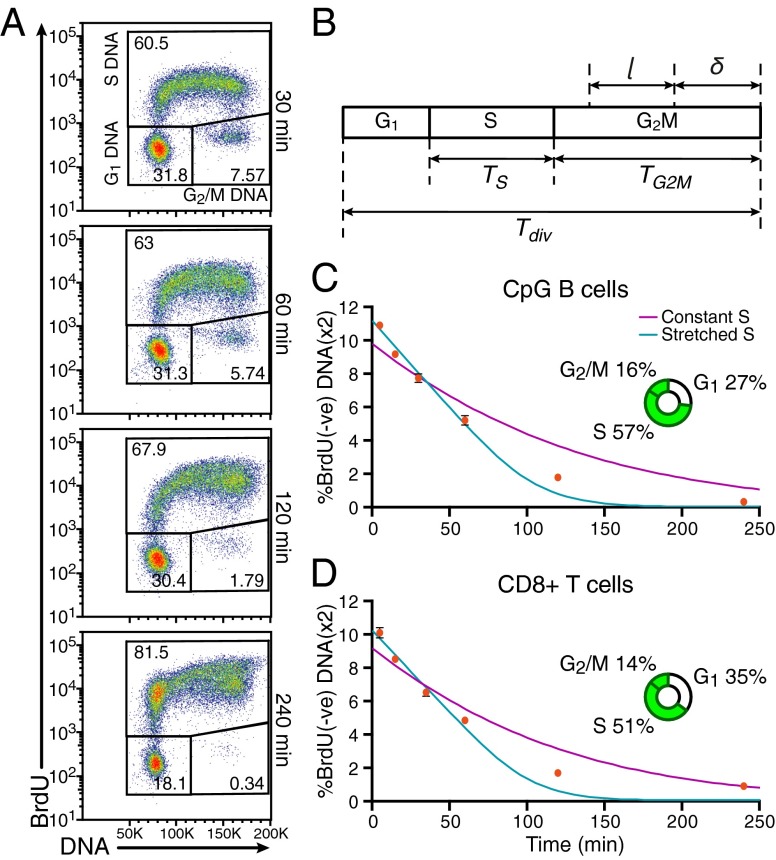
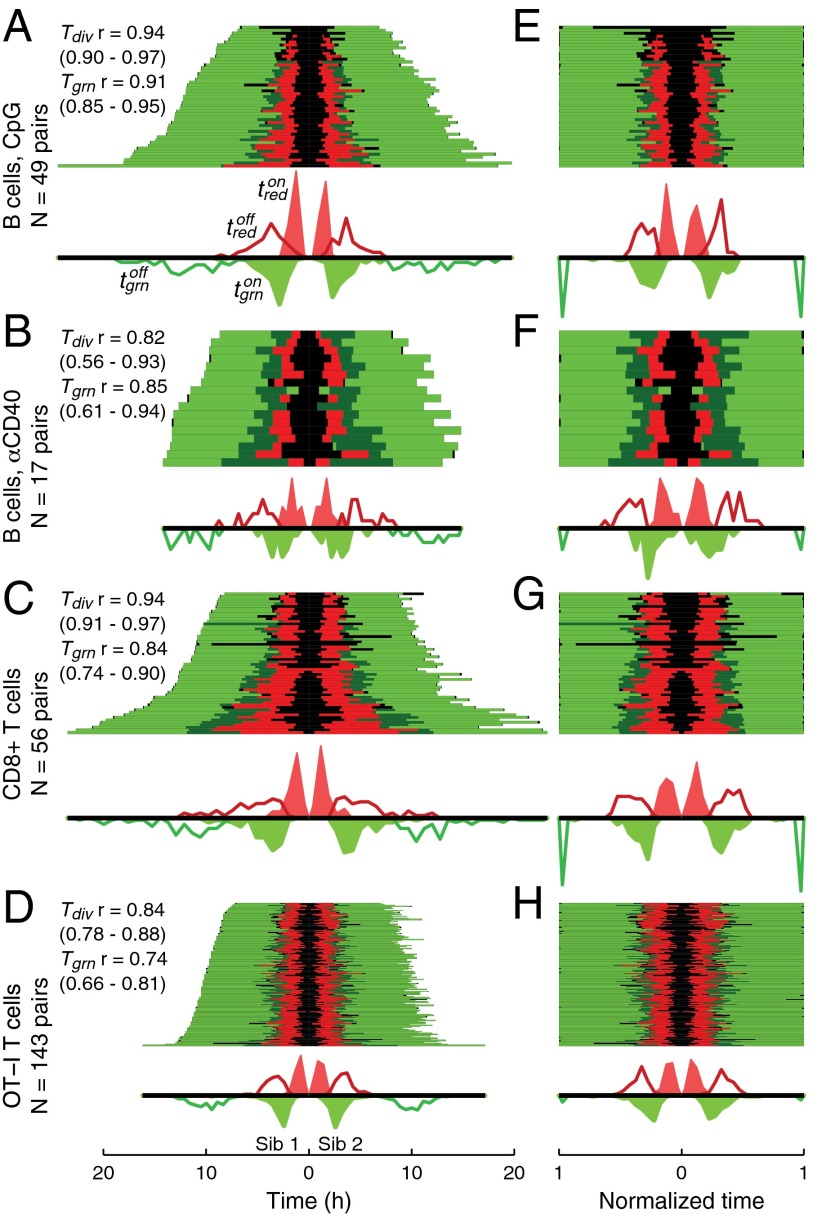
Stochastic variation in cell cycle time is a consistent feature of otherwise similar cells within a growing population. Classic studies concluded that the bulk of the variation occurs in the G1 phase, and many mathematical models assume a constant time for traversing the S/G2/M phases. By direct observation of transgenic fluorescent fusion proteins that report the onset of S phase, we establish that dividing B and T lymphocytes spend a near-fixed proportion of total division time in S/G2/M phases, and this proportion is correlated between sibling cells. This result is inconsistent with models that assume independent times for consecutive phases. Instead, we propose a stretching model for dividing lymphocytes where all parts of the cell cycle are proportional to total division time. Data fitting based on a stretched cell cycle model can significantly improve estimates of cell cycle parameters drawn from DNA labeling data used to monitor immune cell dynamics.

Keywords: FUCCI; Smith-Martin model; bromodeoxyuridine; lognormal distribution; time lapse microscopy.


Conflict of interest statement

The authors declare no conflict of interest.

Figures

Fig. 1.
Fig. 1.
Temporal profiles of FUCCI reporter fluorescence in dividing lymphocytes and schematic of the analysis method for a single division cycle. (A) Frames from time-lapse imaging of CpG-stimulated lymphocytes showing two division cycles followed by cessation of proliferation. (B) Detected normalized fluorescence in the FUCCI red and green channels using the automated method described in Materials and Methods and SI Appendix, Text 5. (C) Schematic of the changes in fluorescence over a single division cycle with total division time, Tdiv (judged manually by cell morphology) time from division until offset of red (mKO2) fluorescence, Tred, and time from the onset of green (mAG) fluorescence to the next division, Tgrn.
Fig. 2.
Fig. 2.
Linear relationship between the total division time and the duration of the combined S/G2/M phases for primary B and T lymphocytes responding to different stimuli. (A) CpG-stimulated B cells, slope = 0.73 (0.71;0.76), r = 0.93 (0.90;0.95). (B) αCD40- and IL-4–stimulated B cells, slope = 0.78 (0.74;0.82), r = 0.87 (0.77;0.93). (C) αCD3- and IL-2–stimulated CD8+ T cells, slope = 0.65 (0.63;0.67), r = 0.90 (0.86;0.93). (D) OT-I CD8+ T cells stimulated with high-affinity peptide and IL-2, slope = 0.72 (0.71;0.73), r = 0.80 (0.76;0.84). Solid blue lines show the fitted linear relations of the form y = (slope)*x; dashed red lines show 95% bootstrapped confidence intervals; r and numbers in parentheses show Pearson’s correlation coefficient and 95% confidence intervals based on Fisher transformation. The slope equates to the stretching parameter for S/G2/M used elsewhere, kSG2M. The duration of the combined S/G2/M phases (estimated as the duration of green fluorescence) appears to take approximately the same proportion (slope of the fitted line, kSG2M) of the total division time within each group of cells. This proportion is schematically represented with pie charts. The linear relationship with high slope and high correlation coefficient indicates that the S/G2/M phase occupies the majority of the cell cycle and is responsible for the majority of variation in total division time (see SI Appendix, Fig. S6, for direct visualization of the distributions of times in each of the phases and total division time, and comparison of sample means and SDs).
Fig. 3.
Fig. 3.
Alpha plots (empirical tail distributions) for estimated times spent in G1 phase (Left), S/G2/M phases (Center) and total division times (Right) overlaid with fitted models for different experiments. (A) CpG-stimulated B cells. (B) αCD40- and IL-4–stimulated B cells. (C) αCD3- and IL-2–stimulated CD8+ T cells. (D) OT-I CD8+ T cells stimulated with high-affinity peptide and IL-2. Lag-exponential, exponentially modified Gaussian (Smith and Martin model), and stretched lognormal models were defined and fitted as explained in SI Appendix, Text 1. The data points are a Kaplan−Meier estimate of the empirical survival curve, and the dashed lines indicate 95% confidence intervals calculated using Greenwood’s formula. In each plot, one to three data points below 0.01 on the vertical axis are not shown (SI Appendix, Text 6).
Fig. 4.
Fig. 4.
DNA labeling with BrdU and direct staining with 7AAD in proliferating lymphocytes, and fitting with the stretched and constant S-phase models. (A) Flow cytometry plots of BrdU versus DNA for different lengths of BrdU pulse to CpG-stimulated B cells showing that the BrdU(−ve) DNA(×2) population diminishes with increasing pulse length. (B) Schematic establishing notation for the mathematical modeling described in detail in SI Appendix, Text 3. Here Tdiv is the total division time, TS is the time spent in S, TG2M is the time spent in G2/M, δ is the remaining division time, and l is the BrdU pulse length. (C and D) Percentages BrdU(−ve) DNA(×2) as a function of BrdU pulse length for CpG-stimulated B cells (C) or αCD3- and IL-2–stimulated CD8+ T cells (D), with fits of mathematical models described in text and SI Appendix, Text 3. Means are shown with error bars indicating ±SE in the mean (SEM) of three replicate wells (note that for some points, the error bars are so small that they are not visible by eye).
Fig. 5.
Fig. 5.
Cell cycle phases are highly correlated in sibling cells. Bars represent total times to divide for sibling cells (left- and right-hand sides), and colors show temporal location of red fluorescence (red), green fluorescence (green), both (dark green), or none (black). The durations are shown either in hours (AD) or relative to the total time to divide (EH) for B cells, CpG (A and E), B cells, αCD40 (B and F), CD8+ T cells (C and G), and OT-I T cells (D and H) The histograms under each group of bars show the distributions of times to onset of red (filled red curves), offset of red (red lines), onset of green (filled green curves), and offset of green (green lines) for corresponding groups of cells.

References

    1. Howard A, Pelc SR. Nuclear incorporation of P-32 as demonstrated by autoradiographs. Exp Cell Res. 1951;2(2):178–187.
    1. Steel GG. Autoradiographic analysis of the cell cycle: Howard and Pelc to the present day. Int J Radiat Biol Relat Stud Phys Chem Med. 1986;49(2):227–235. - PubMed
    1. Killander D, Zetterberg A. Quantitative cytochemical studies on interphase growth. I. Determination of DNA, RNA and mass content of age determined mouse fibroblasts in vitro and of intercellular variation in generation time. Exp Cell Res. 1965;38(2):272–284. - PubMed
    1. Dawson KB, Madoc-Jones H, Field EO. Variations in the generation times of a strain of rat sarcoma cells in culture. Exp Cell Res. 1965;38(1):75–84. - PubMed
    1. Marin G, Bender MA. Radiation-induced mammalian cell death: Lapse-time cinemicrographic observations. Exp Cell Res. 1966;43(2):413–423. - PubMed

Publication types