. 2014 Apr 14;369(1643):20130194.
doi: 10.1098/rstb.2013.0194. Print 2014.

Imaging spectroscopy links aspen genotype with below-ground processes at landscape scales

Affiliations

Imaging spectroscopy links aspen genotype with below-ground processes at landscape scales

Michael D Madritch et al. Philos Trans R Soc Lond B Biol Sci. .

Abstract

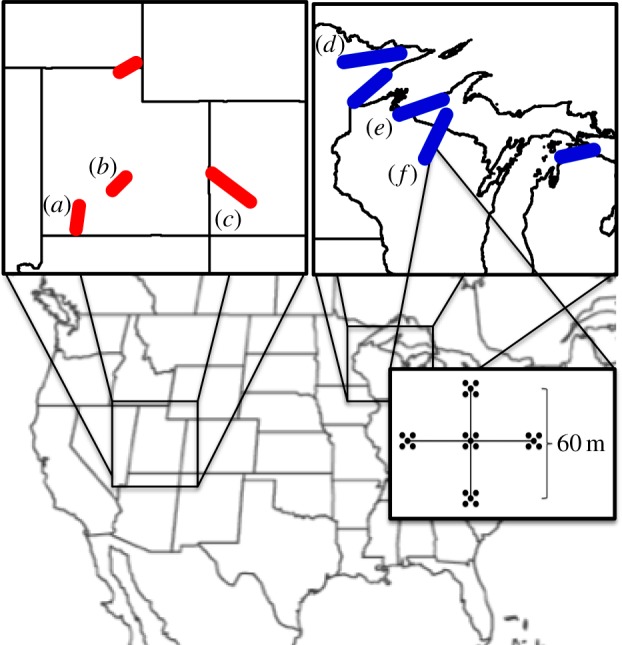
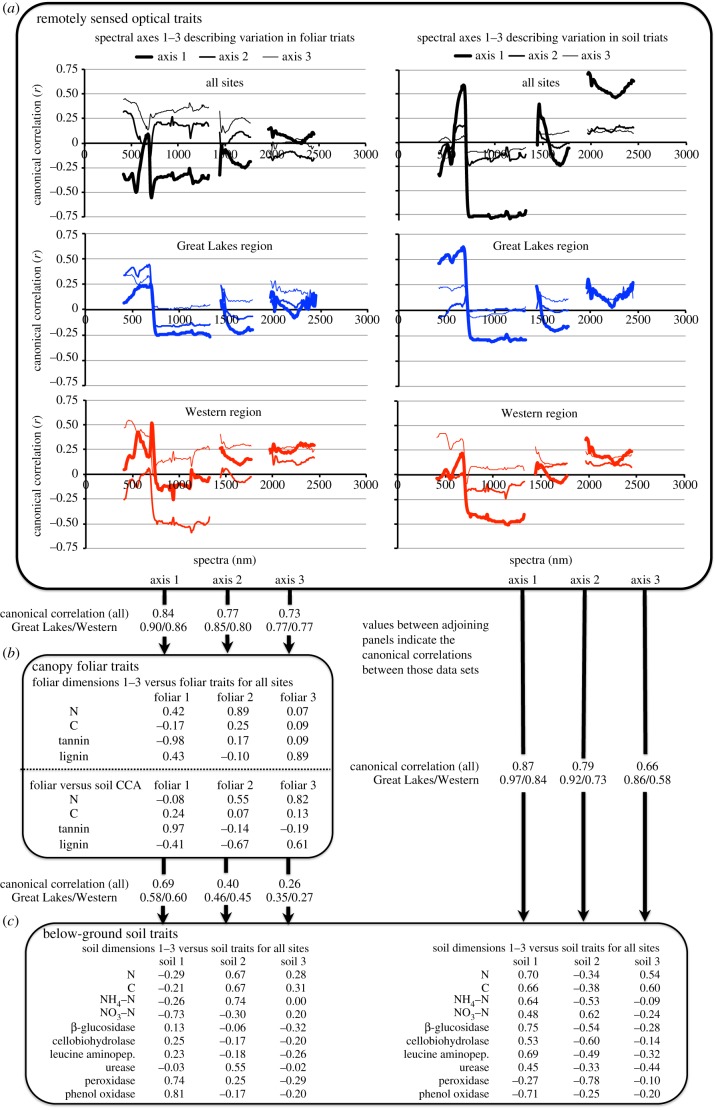
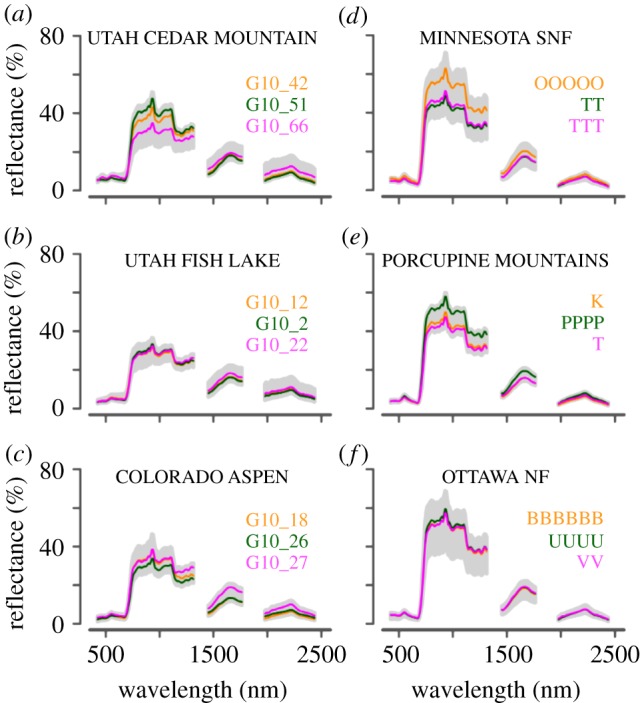
Fine-scale biodiversity is increasingly recognized as important to ecosystem-level processes. Remote sensing technologies have great potential to estimate both biodiversity and ecosystem function over large spatial scales. Here, we demonstrate the capacity of imaging spectroscopy to discriminate among genotypes of Populus tremuloides (trembling aspen), one of the most genetically diverse and widespread forest species in North America. We combine imaging spectroscopy (AVIRIS) data with genetic, phytochemical, microbial and biogeochemical data to determine how intraspecific plant genetic variation influences below-ground processes at landscape scales. We demonstrate that both canopy chemistry and below-ground processes vary over large spatial scales (continental) according to aspen genotype. Imaging spectrometer data distinguish aspen genotypes through variation in canopy spectral signature. In addition, foliar spectral variation correlates well with variation in canopy chemistry, especially condensed tannins. Variation in aspen canopy chemistry, in turn, is correlated with variation in below-ground processes. Variation in spectra also correlates well with variation in soil traits. These findings indicate that forest tree species can create spatial mosaics of ecosystem functioning across large spatial scales and that these patterns can be quantified via remote sensing techniques. Moreover, they demonstrate the utility of using optical properties as proxies for fine-scale measurements of biodiversity over large spatial scales.

Keywords: above- and below-ground linkages; intraspecific diversity; plant chemistry.


Figures

Figure 1.
Figure 1.
Map of AVIRIS scenes and sampling areas. Our sampling focused on aspen stands located in the Great Lakes and Intermountain West (Western) regions of the continental USA. Multiple AVIRIS scenes were collected in 2009 for the Great Lakes and in 2010 for the Western regions. Within each transect, we established sampling sites for paired foliage and soil samples based. At each site, five 5 × 5 m crosses were nested within a larger 60 × 60 m cross (Ntree = 25 per site). Labels (a–f) correspond to subpanels in figure 3.
Figure 2.
Figure 2.
Conceptual diagram of connections between optical, foliar and soil traits. Canonical correlations describe the relationships between canopy spectra, canopy foliar traits and below-ground soil traits (left side of figure). Panel (a) displays the correlation of the first three spectral canonical axes with AVIRIS bands for all sites, Great Lakes and Western regions. The darkest line on each plot is of the first canonical variable, i.e. the linear combination of spectral data having the highest correlation with the linear combination of the second dataset (either foliar traits on left, or soil traits on right). Note that panel (a) displays many high negative correlations; absolute value indicates the strength of the relationships. Spectral canonical axes are then correlated with canonical axes that describe foliar traits, which are shown in panel (b). Foliar canonical variables are then correlated with canonical variables that describe soil traits, which are shown in panel (c). In addition to spectra–foliar–soil CCAs, we also describe the direct relationship between spectra and soils (right side of panel).
Figure 3.
Figure 3.
Within and across genet variation in spectra in multiple AVIRIS scenes. Grey-shaded areas represent the range of spectral variation among genets within an AVIRIS scene. Solid-coloured lines represent the average spectrum for representative genets. Each subpanel corresponds to a separate multi-AVIRIS scene area. Western areas are on the left and Great Lakes areas are on the right. Subpanel labels (a–f) correspond to AVIRIS scenes in figure 1. Alphanumeric codes within subpanels correspond to unique aspen genotypes. SNF, Superior National Forest; SF, State Forest.

References

    1. Pereira HM, et al. 2010. Scenarios for global biodiversity in the 21st century. Science 330, 1496–1501. (10.1126/science.1196624) - DOI - PubMed
    1. Vitousek PM, Mooney HA, Lubchenco J, Melillo JM. 1997. Human domination of earth's ecosystems. Science 277, 494–499. (10.1126/science.277.5325.494) - DOI
    1. Haberl H, Erb KH, Krausmann F, Gaube V, Bondeau A, Plutzar C, Gingrich S, Lucht W, Fischer-Kowalski M. 2007. Quantifying and mapping the human appropriation of net primary production in earth's terrestrial ecosystems. Proc. Natl Acad. Sci. USA 104, 12 942–12 945. (10.1073/pnas.0704243104) - DOI - PMC - PubMed
    1. Sgro CM, Lowe AJ, Hoffmann AA. 2011. Building evolutionary resilience for conserving biodiversity under climate change. Evol. Appl. 4, 326–337. (10.1111/j.1752-4571.2010.00157.x) - DOI - PMC - PubMed
    1. Cardinale BJ, et al. 2012. Biodiversity loss and its impact on humanity. Nature 486, 59–67. (10.1038/nature11148) - DOI - PubMed

Publication types