. 2014 Apr 15;10(4):355-62.
doi: 10.5664/jcsm.3600.

Sleep apnea and 20-year follow-up for all-cause mortality, stroke, and cancer incidence and mortality in the Busselton Health Study cohort

Affiliations

Sleep apnea and 20-year follow-up for all-cause mortality, stroke, and cancer incidence and mortality in the Busselton Health Study cohort

Nathaniel S Marshall et al. J Clin Sleep Med. .

Abstract

Objective: To ascertain whether objectively measured obstructive sleep apnea (OSA) independently increases the risk of all cause death, cardiovascular disease (CVD), coronary heart disease (CHD), stroke or cancer.

Design: Community-based cohort.

Setting and participants: 400 residents of the Western Australian town of Busselton.

Measures: OSA severity was quantified via the respiratory disturbance index (RDI) as measured by a single night recording in November-December 1990 using the MESAM IV device, along with a range of other risk factors. Follow-up for deaths and hospitalizations was ascertained via record linkage to the end of 2010.

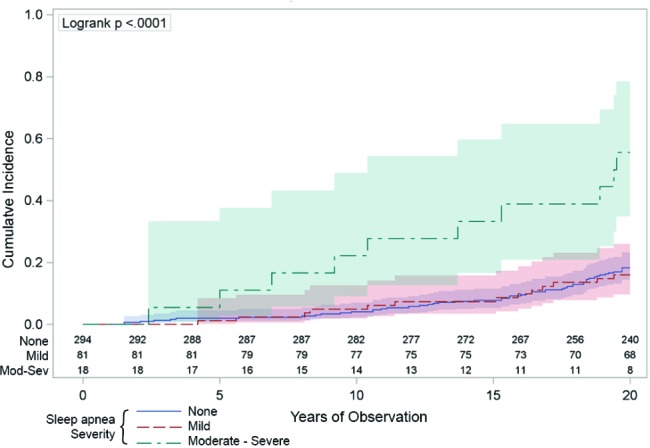
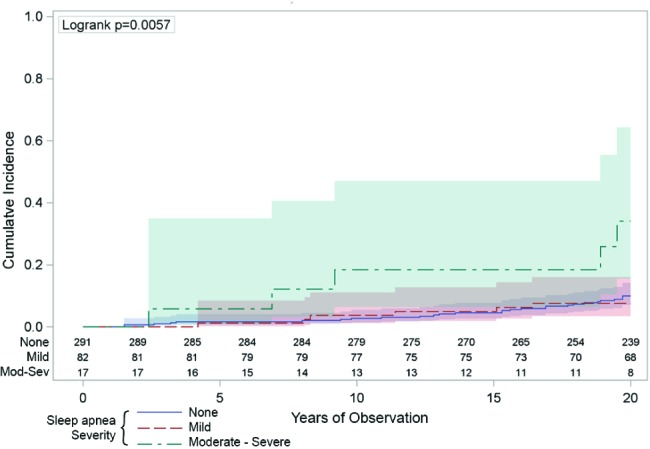
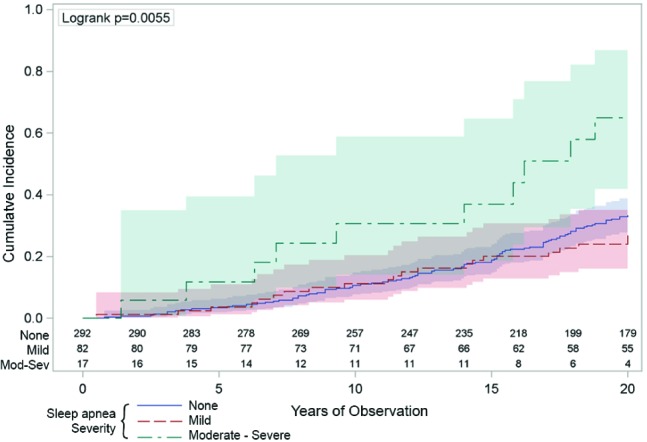
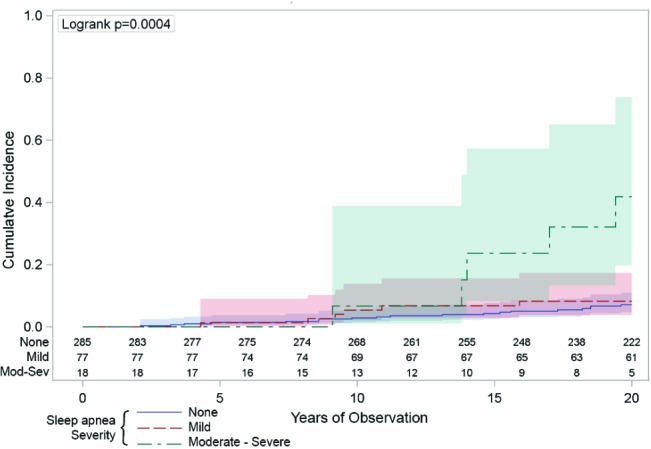
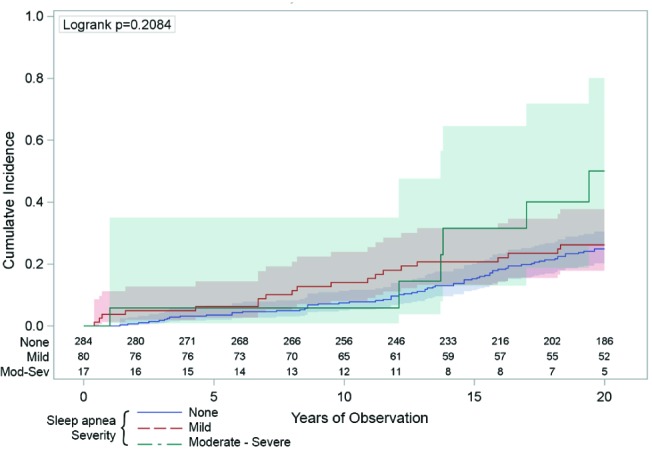
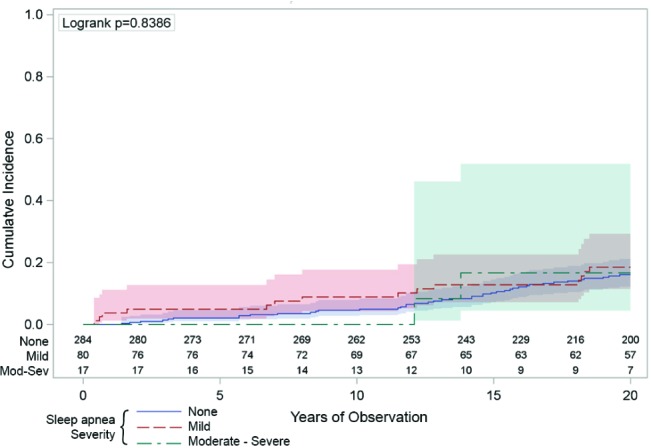
Results: We had follow-up data in 397 people and then removed those with a previous stroke (n = 4) from the mortality/ CVD/CHD/stroke analyses and those with cancer history from the cancer analyses (n = 7). There were 77 deaths, 103 cardiovascular events (31 strokes, 59 CHD) and 125 incident cases of cancer (39 cancer fatalities) during 20 years follow-up. In fully adjusted models, moderate-severe OSA was significantly associated with all-cause mortality (HR = 4.2; 95% CI 1.9, 9.2), cancer mortality (3.4; 1.1, 10.2), incident cancer (2.5; 1.2, 5.0), and stroke (3.7; 1.2, 11.8), but not significantly with CVD (1.9; 0.75, 4.6) or CHD incidence (1.1; 0.24, 4.6). Mild sleep apnea was associated with a halving in mortality (0.5; 0.27, 0.99), but no other outcome, after control for leading risk factors.

Conclusions: Moderate-to-severe sleep apnea is independently associated with a large increased risk of all-cause mortality, incident stroke, and cancer incidence and mortality in this community-based sample.

Keywords: Sleep disordered breathing; coronary artery disease; melanoma.


Figures

Figure 1
Figure 1. The univariate association between sleep apnea and all-cause mortality.
The vertical axis indicates the cumulative number of deaths was higher across the 20 years (horizontal axis) in those people with moderate-severe sleep apnea (respiratory disturbance index [RDI] ≥ 15/h: the green line) compared to those with mild sleep apnea (RDI 5-14: the red line) or those with no sleep apnea (RDI < 5: the blue line). The numbers just above the horizontal axis indicate the numbers of people being observed at each 2-year time point in each of the sleep apnea groups. The shaded areas around the lines represent the 95% confidence intervals.
Figure 2
Figure 2. The univariate association between sleep apnea and cancer mortality.
The vertical axis indicates the cumulative number of deaths attributed to cancer was higher across the 20 years (horizontal axis) in those people with moderate-severe sleep apnea (respiratory disturbance index [RDI] ≥ 15/h: the green line) compared to those with mild sleep apnea (RDI 5-14: the red line) or those with no sleep apnea (RDI < 5: the blue line). The numbers just above the horizontal axis indicate the numbers of people being observed at each 2-year time point in each of the sleep apnea groups. The shaded areas around the lines represent the 95% confidence intervals.
Figure 3
Figure 3. The univariate association between sleep apnea and the incidence of cancer.
The vertical axis indicates the cumulative number cancer diagnoses was higher across the 20 years (horizontal axis) in those people with moderate-severe sleep apnea (respiratory disturbance index [RDI] ≥ 15/h: the green line) compared to those with mild sleep apnea (RDI 5-14: the red line) or those with no sleep apnea (RDI < 5: the blue line). The numbers just above the horizontal axis indicate the numbers of people being observed at each 2-year time point in each of the sleep apnea groups. The shaded areas around the lines represent the 95% confidence intervals.
Figure 4
Figure 4. The univariate association between sleep apnea and incident stroke.
The vertical axis indicates the cumulative number hospitalizations or deaths from stroke was higher across the 20 years (horizontal axis) in those people with moderate-severe sleep apnea (respiratory disturbance index [RDI] ≥ 15/h: the green line) compared to those with mild sleep apnea (RDI 5-14: the red line) or those with no sleep apnea (RDI < 5: the blue line). The numbers just above the horizontal axis indicate the numbers of people being observed at each 2-year time point in each of the sleep apnea groups. The shaded areas around the lines represent the 95% confidence intervals.
Figure 5
Figure 5. The univariate association between sleep apnea and incidence of cardiovascular disease.
The vertical axis indicates the cumulative number of hospitalizations or deaths from coronary heart disease was not statistically higher across the 20 years (horizontal axis) in those people with moderate-severe sleep apnea (respiratory disturbance index [RDI] ≥ 15/h: the green line) compared to those with mild sleep apnea (RDI 5-14: the red line) or those with no sleep apnea (RDI < 5: the blue line). The numbers just above the horizontal axis indicate the numbers of people being observed at each 2-year time point in each of the sleep apnea groups. The shaded areas around the lines represent the 95% confidence intervals.
Figure 6
Figure 6. The univariate association between sleep apnea and the incidence of coronary heart disease.
The vertical axis indicates the cumulative number of hospitalizations or deaths from coronary heart disease was not statistically higher across the 20 years (horizontal axis) in those people with moderate-severe sleep apnea (respiratory disturbance index [RDI] ≥ 15/h—the green line) compared to those with mild sleep apnea (RDI 5-14—the red line) or those with no sleep apnea (RDI < 5—the blue line). The numbers just above the horizontal axis indicate the numbers of people being observed at each 2-year time point in each of the sleep apnea groups. The shaded areas around the lines represent the 95% confidence intervals.

Comment in

References

    1. Punjabi NM. The epidemiology of adult obstructive sleep apnea. Proc Am Thorac Soc. 2008;5:136–143. - PMC - PubMed
    1. Marshall NS, Wong KK, Liu PY, et al. Sleep apnea as an independent risk factor for all-cause mortality: The Busselton Health Study. Sleep. 2008;31:1079–85. - PMC - PubMed
    1. Punjabi NM, Caffo BS, Goodwin JL, et al. Sleep-disordered breathing and mortality: A prospective cohort study. PLoS Med. 2009;6:e1000132. - PMC - PubMed
    1. Redline S, Yenokyan G, Gottlieb DJ, et al. Obstructive sleep apnea-hypopnea and incident stroke: The Sleep Heart Health Study. Am J Respir Crit Care Med. 2010;182:269–77. - PMC - PubMed
    1. Munoz R, Duran-Cantolla J, Martinez-Vila E, et al. Severe sleep apnea and risk of ischemic stroke in the elderly. Stroke. 2006;37:2317–21. - PubMed

Publication types

MeSH terms