. 2014 Apr 15:15:284.
doi: 10.1186/1471-2164-15-284.

ngs.plot: Quick mining and visualization of next-generation sequencing data by integrating genomic databases

Affiliations

ngs.plot: Quick mining and visualization of next-generation sequencing data by integrating genomic databases

Li Shen et al. BMC Genomics. .

Abstract

Background: Understanding the relationship between the millions of functional DNA elements and their protein regulators, and how they work in conjunction to manifest diverse phenotypes, is key to advancing our understanding of the mammalian genome. Next-generation sequencing technology is now used widely to probe these protein-DNA interactions and to profile gene expression at a genome-wide scale. As the cost of DNA sequencing continues to fall, the interpretation of the ever increasing amount of data generated represents a considerable challenge.

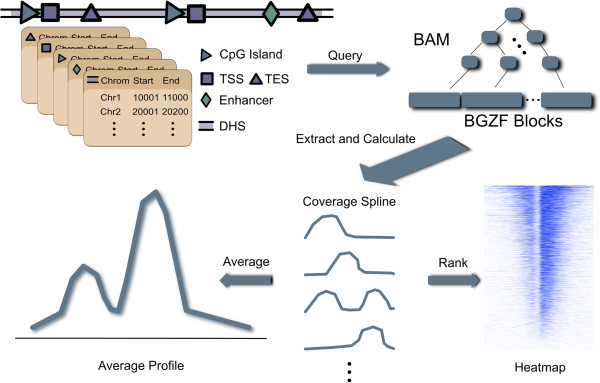
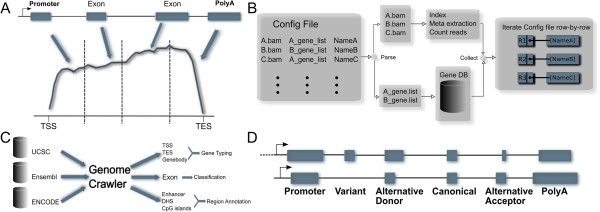
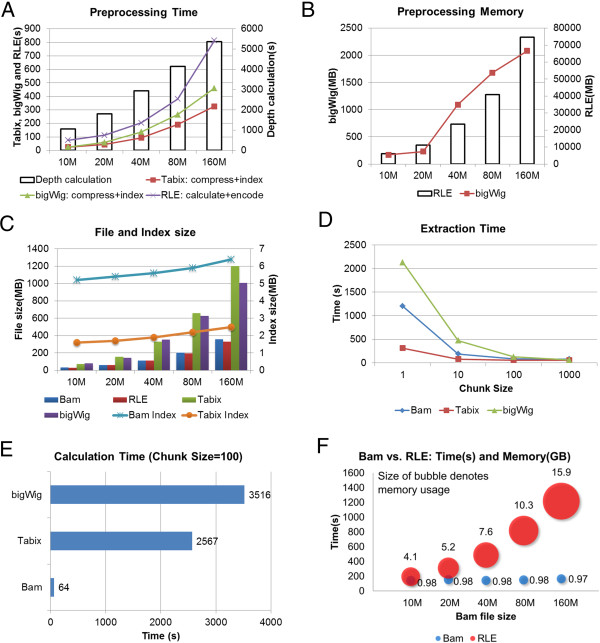
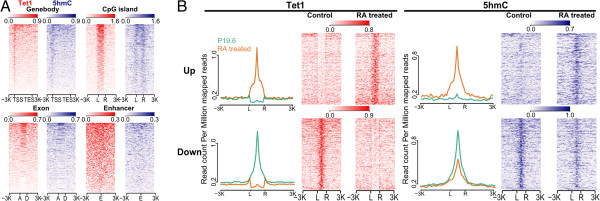
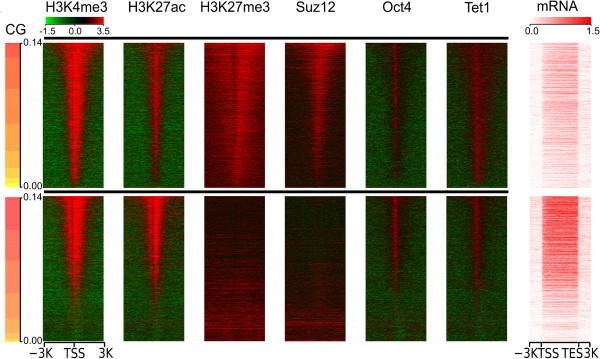
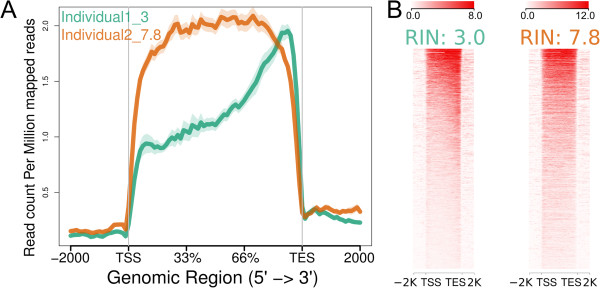
Results: We have developed ngs.plot - a standalone program to visualize enrichment patterns of DNA-interacting proteins at functionally important regions based on next-generation sequencing data. We demonstrate that ngs.plot is not only efficient but also scalable. We use a few examples to demonstrate that ngs.plot is easy to use and yet very powerful to generate figures that are publication ready.

Conclusions: We conclude that ngs.plot is a useful tool to help fill the gap between massive datasets and genomic information in this era of big sequencing data.


Figures

Figure 1
Figure 1
The workflow of an ngs.plot run. The functional elements in the database are classified based on their types, such as TSS, CGI, enhancer, DHS. The genomic coordinates of the functional elements are used to query a BAM file which is indexed by an R-tree like data structure. Coverage vectors are calculated based on the retrieved alignments, which are further represented as average profiles or heatmaps.
Figure 2
Figure 2
Design and implementation of the ngs.plot program. A. In RNA-seq mode, the program performs exon splicing in silico: the coverage vectors for exons are concatenated with intronic coverage removed. B. A configuration file can be used to create any combination of BAM files and regions. The program will parse the configuration and perform pre-processing on BAM files. It will then iterate through each line of the configuration and determine the arrangement of the output figure. C. A genome crawler is developed to automatically pull genomic annotations from three public databases – UCSC genome browser, Ensembl and ENCODE. It then performs more elaborate classifications on the functional elements and compiles them into R binary tables. D. The exon classification algorithm classifies exons into seven categories: promoter, variant, alternative donor, alternative acceptor, alternative both, and polyA based on pairwise comparisons of exon boundaries.
Figure 3
Figure 3
Performance benchmark of different strategies. A. Pre-processing time for different alignment sizes: Coverage calculation time for Tabix and bigWig is shown as vertical bars; Coverage compression and indexing combined time for Tabix and bigWig is shown as red square and green triangle trend lines, respectively; RLE calculates and encodes the coverage and the time is shown as a purple X-shape trend line. For the vertical bars, the scale is on the right y-axis. For the trend lines, the scale is on the left y-axis. B. Peak memory usage during pre-processing for different alignment sizes: RLE is shown as vertical bars whose scale is on the right y-axis; bigWig is shown as a red square trend line whose scale is on the left y-axis. C. File and index sizes for different alignment sizes: Bam, RLE, Tabix, and bigWig are shown as colour columns whose scale is on the left y-axis; Bam and Tabix index sizes are shown as trend lines whose scale is on the right y-axis. Please note that RLE, Tabix, and bigWig coverage files are all converted from BAM files, which incur extra storage. D. Alignment extraction time for all TSS ± 5 Kb regions on the mouse genome for different chunk sizes based on 10 million short reads. E. Coverage calculation time for all TSS ± 5 Kb regions on the mouse genome for chunk size of 100 based on 10 million short reads. F. Alignment extraction and coverage calculation combined time and peak memory usage for Bam and RLE for different alignment sizes. The size of the bubbles denotes memory usage and the vertical location of the bubble centers denotes time. Test is based on all TSS ± 5 Kb regions in the mouse genome.
Figure 4
Figure 4
Applying ngs.plot to the study of Tet1 in mESC P19.6 cells during differentiation. All heatmaps are resized to match each other’s height for display purposes. A. Tet1 and 5hmC enrichment at different functional regions – CGIs at proximal promoters, canonical exons, and enhancers, including 3 Kb flanking regions. All regions are ranked by the “total” algorithm. “L” – 5’ left, “R” – 3’ right as defined by the gene that includes the CGI; “A” – 5’ acceptor, “D” – 3’ donor; “E” – enhancer center. B. Tet1 and 5hmC enrichment before and after RA treatment at Tet1’s differential sites defined by diffReps, filtered by active enhancers, including 3 Kb flanking regions. The differential sites are ranked by the “diff” algorithm. The up and down sites are plotted separately. Both average profiles and heatmaps are shown. “L” – genomic left, “R” – genomic right as lower coordinates are to the left of higher coordinates.
Figure 5
Figure 5
Applying ngs.plot to the study of epigenomic regulation of PT and nPT promoters in mESCs. The log2 enrichment ratios of several histone marks and transcription factors vs. DNA input at TSS ± 3 Kb regions. The TSSs are ranked by CGPs in descending order (using algorithm “none”). Gene expression levels are illustrated by RNA-seq enrichment in the same order (using RNA-seq mode), including 3 Kb flanking regions. The upper panel represents PT promoters and the lower panel represents nPT promoters. They are resized to have the same height.
Figure 6
Figure 6
RNA-seq plots of two human postmortem brain samples with different RIN values. A. Average profiles. B. Heatmaps.

References

    1. Metzker ML. Sequencing technologies - the next generation. Nat Rev Genet. 2010;15(1):31–46. doi: 10.1038/nrg2626. - DOI - PubMed
    1. Koboldt Daniel C, Steinberg Karyn M, Larson David E, Wilson Richard K, Mardis ER. The Next-Generation Sequencing Revolution and Its Impact on Genomics. Cell. 2013;15(1):27–38. doi: 10.1016/j.cell.2013.09.006. - DOI - PMC - PubMed
    1. Morozova O, Marra MA. Applications of next-generation sequencing technologies in functional genomics. Genomics. 2008;15(5):255–264. doi: 10.1016/j.ygeno.2008.07.001. - DOI - PubMed
    1. Kent WJ, Sugnet CW, Furey TS, Roskin KM, Pringle TH, Zahler AM, Haussler D. The Human Genome Browser at UCSC. Genome Res. 2002;15(6):996–1006. doi: 10.1101/gr.229102. - DOI - PMC - PubMed
    1. Robinson JT, Thorvaldsdóttir H, Winckler W, Guttman M, Lander ES, Getz G, Mesirov JP. Integrative genomics viewer. Nat Biotechnol. 2011;15(1):24–26. doi: 10.1038/nbt.1754. - DOI - PMC - PubMed

Publication types