

Multifocality and recurrence risk: a quantitative model of field cancerization
- PMID: 24735903
- PMCID: PMC4589890
- DOI: 10.1016/j.jtbi.2014.02.042
Multifocality and recurrence risk: a quantitative model of field cancerization
Abstract
Primary tumors often emerge within genetically altered fields of premalignant cells that appear histologically normal but have a high chance of progression to malignancy. Clinical observations have suggested that these premalignant fields pose high risks for emergence of recurrent tumors if left behind after surgical removal of the primary tumor. In this work, we develop a spatio-temporal stochastic model of epithelial carcinogenesis, combining cellular dynamics with a general framework for multi-stage genetic progression to cancer. Using the model, we investigate how various properties of the premalignant fields depend on microscopic cellular properties of the tissue. In particular, we provide analytic results for the size-distribution of the histologically undetectable premalignant fields at the time of diagnosis, and investigate how the extent and the geometry of these fields depend upon key groups of parameters associated with the tissue and genetic pathways. We also derive analytical results for the relative risks of local vs. distant secondary tumors for different parameter regimes, a critical aspect for the optimal choice of post-operative therapy in carcinoma patients. This study contributes to a growing literature seeking to obtain a quantitative understanding of the spatial dynamics in cancer initiation.
Keywords: Cancer initiation; Evolution; Stochastic spatial models.
Copyright © 2014 Elsevier Ltd. All rights reserved.
Figures
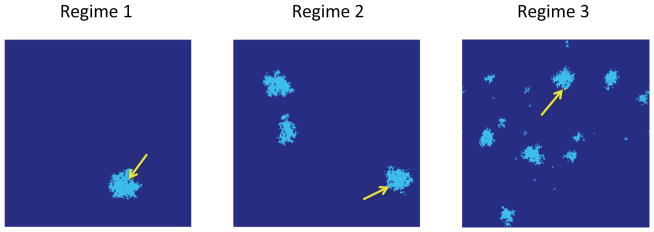
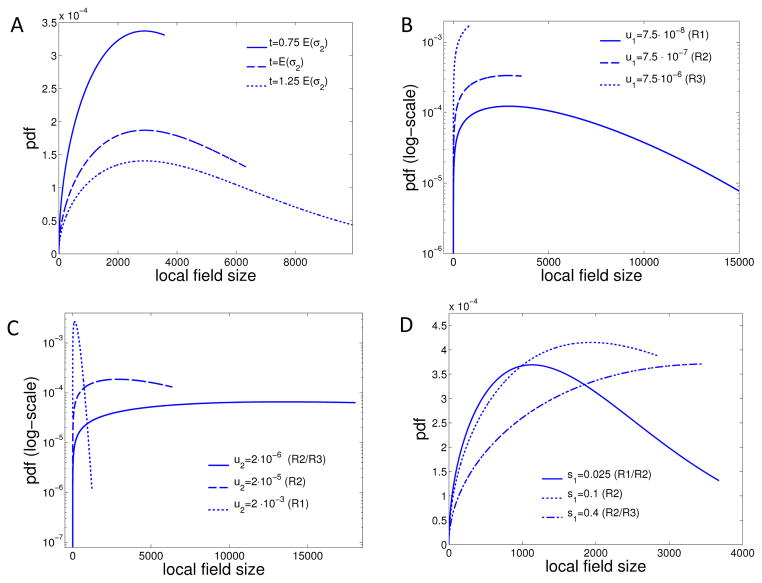
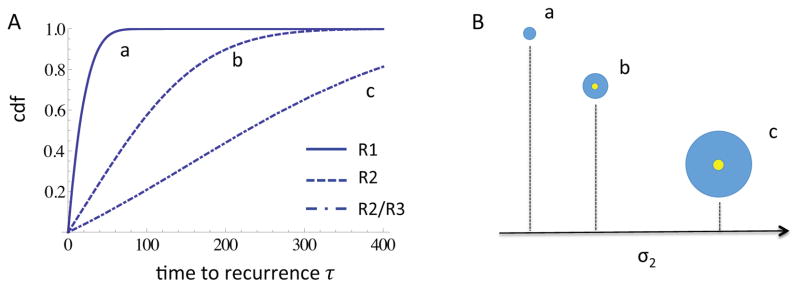
 (σ2) = 123, Ê(Rl) = 8; (b)
(σ2) = 281, Ê(Rl) = 31; (c)
(σ2) = 474, Ê(Rl) = 55.
(σ2) = 123, Ê(Rl) = 8; (b)
(σ2) = 281, Ê(Rl) = 31; (c)
(σ2) = 474, Ê(Rl) = 55.
Similar articles
-
Computational modeling of locoregional recurrence with spatial structure identifies tissue-specific carcinogenic profiles.Front Oncol. 2023 Apr 6;13:1116210. doi: 10.3389/fonc.2023.1116210. eCollection 2023. Front Oncol. 2023. PMID: 37091178 Free PMC article.
-
Quantitative Clinical Imaging Methods for Monitoring Intratumoral Evolution.Methods Mol Biol. 2017;1513:61-81. doi: 10.1007/978-1-4939-6539-7_6. Methods Mol Biol. 2017. PMID: 27807831 Review.
-
Cancer stem cells and field cancerization of oral squamous cell carcinoma.Oral Oncol. 2015 Jul;51(7):643-51. doi: 10.1016/j.oraloncology.2015.04.006. Epub 2015 Apr 23. Oral Oncol. 2015. PMID: 25920765 Review.
-
An overview of the risk factors associated with multiple oral premalignant lesions with a case report of extensive field cancerization in a female patient.Biomed Pap Med Fac Univ Palacky Olomouc Czech Repub. 2015 Jun;159(2):178-83. doi: 10.5507/bp.2013.092. Epub 2014 Jan 3. Biomed Pap Med Fac Univ Palacky Olomouc Czech Repub. 2015. PMID: 24401899
-
Fields and field cancerization: the preneoplastic origins of cancer: asymptomatic hyperplastic fields are precursors of neoplasia, and their progression to tumors can be tracked by saturation density in culture.Bioessays. 2011 Mar;33(3):224-31. doi: 10.1002/bies.201000067. Epub 2011 Jan 21. Bioessays. 2011. PMID: 21254148
Cited by
-
Open questions and novel concepts in oral cancer surgery.Eur Arch Otorhinolaryngol. 2016 Aug;273(8):1975-85. doi: 10.1007/s00405-015-3655-0. Epub 2015 May 24. Eur Arch Otorhinolaryngol. 2016. PMID: 26003319 Review.
-
A computational model for the cancer field effect.Front Artif Intell. 2023 Jul 4;6:1060879. doi: 10.3389/frai.2023.1060879. eCollection 2023. Front Artif Intell. 2023. PMID: 37469932 Free PMC article.
-
Precancer in ulcerative colitis: the role of the field effect and its clinical implications.Carcinogenesis. 2018 Jan 12;39(1):11-20. doi: 10.1093/carcin/bgx117. Carcinogenesis. 2018. PMID: 29087436 Free PMC article. Review.
-
A spatial model predicts that dispersal and cell turnover limit intratumour heterogeneity.Nature. 2015 Sep 10;525(7568):261-4. doi: 10.1038/nature14971. Epub 2015 Aug 26. Nature. 2015. PMID: 26308893 Free PMC article.
-
An evolutionary perspective on field cancerization.Nat Rev Cancer. 2018 Jan;18(1):19-32. doi: 10.1038/nrc.2017.102. Epub 2017 Dec 8. Nat Rev Cancer. 2018. PMID: 29217838 Review.
References
-
- Slaughter Danely P, Southwick Harry W, Smejkal Walter. field cancerization in oral stratified squamous epithelium. clinical implications of multicentric origin. Cancer. 1953;6(5):963–968. - PubMed
-
- Braakhuis Boudewijn JM, Tabor Maarten P, Alain Kummer J, René Leemans C, Brakenhoff Ruud H. A genetic explanation of slaughter’s concept of field cancerization evidence and clinical implications. Cancer Research. 2003;63(8):1727–1730. - PubMed
-
- Chai Hong, Brown Robert E. Field effect in cancer–an update. Annals of Clinical & Laboratory Science. 2009;39(4):331–337. - PubMed
Publication types
MeSH terms
Grants and funding
LinkOut - more resources
Full Text Sources
Other Literature Sources
