

Reliability of functional magnetic resonance imaging activation during working memory in a multi-site study: analysis from the North American Prodrome Longitudinal Study
- PMID: 24736173
- PMCID: PMC4065837
- DOI: 10.1016/j.neuroimage.2014.04.027
Reliability of functional magnetic resonance imaging activation during working memory in a multi-site study: analysis from the North American Prodrome Longitudinal Study
Abstract
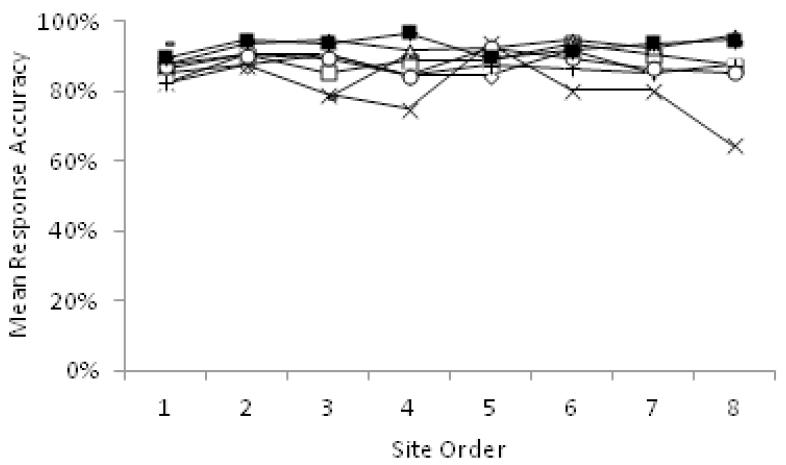
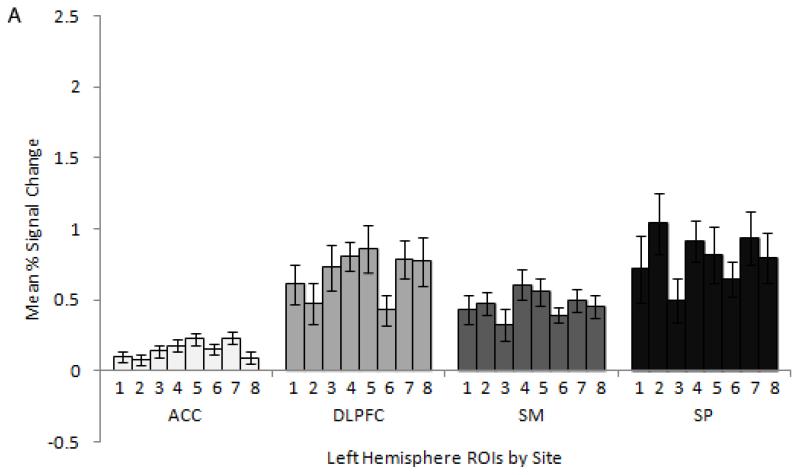
Multi-site neuroimaging studies offer an efficient means to study brain functioning in large samples of individuals with rare conditions; however, they present new challenges given that aggregating data across sites introduces additional variability into measures of interest. Assessing the reliability of brain activation across study sites and comparing statistical methods for pooling functional data are critical to ensuring the validity of aggregating data across sites. The current study used two samples of healthy individuals to assess the feasibility and reliability of aggregating multi-site functional magnetic resonance imaging (fMRI) data from a Sternberg-style verbal working memory task. Participants were recruited as part of the North American Prodrome Longitudinal Study (NAPLS), which comprises eight fMRI scanning sites across the United States and Canada. In the first study sample (n=8), one participant from each home site traveled to each of the sites and was scanned while completing the task on two consecutive days. Reliability was examined using generalizability theory. Results indicated that blood oxygen level-dependent (BOLD) signal was reproducible across sites and was highly reliable, or generalizable, across scanning sites and testing days for core working memory ROIs (generalizability ICCs=0.81 for left dorsolateral prefrontal cortex, 0.95 for left superior parietal cortex). In the second study sample (n=154), two statistical methods for aggregating fMRI data across sites for all healthy individuals recruited as control participants in the NAPLS study were compared. Control participants were scanned on one occasion at the site from which they were recruited. Results from the image-based meta-analysis (IBMA) method and mixed effects model with site covariance method both showed robust activation in expected regions (i.e. dorsolateral prefrontal cortex, anterior cingulate cortex, supplementary motor cortex, superior parietal cortex, inferior temporal cortex, cerebellum, thalamus, basal ganglia). Quantification of the similarity of group maps from these methods confirmed a very high (96%) degree of spatial overlap in results. Thus, brain activation during working memory function was reliable across the NAPLS sites and both the IBMA and mixed effects model with site covariance methods appear to be valid approaches for aggregating data across sites. These findings indicate that multi-site functional neuroimaging can offer a reliable means to increase power and generalizability of results when investigating brain function in rare populations and support the multi-site investigation of working memory function in the NAPLS study, in particular.
Keywords: G-theory; Multi-site; Reliability; Working memory; fMRI.
Copyright © 2014 Elsevier Inc. All rights reserved.
Figures


References
-
- Abbott C, Juarez M, White T, Gollub RL, Pearlson GD, Bustillo J, Lauriello J, Ho B, Bockholt HJ, Clark VP, Magnotta V, Calhoun VD. Antipsychotic dose and diminished neural modulation: a multi-site fMRI study. Progress in Neuro-Psychopharmacology and Biological Psychiatry. 2011;35(2):473–482. - PMC - PubMed
-
- Behrens TEJ, Johansen-Berg H, Woolrich MW, Smith SM, Wheeler-Kingshott CAM, Boulby PA, Barker GJ, Sillery EL, Sheehan K, Ciccarelli O, Thompson AJ, Brady JM, Matthews PM. Non-invasive mapping of connections between human thalamus and cortex using diffusion imaging. Nature Neuroscience. 2003;6(7):750–757. - PubMed
-
- Bennett CM, Miller MB. How reliable are the results from functional magnetic resonance imaging? Annals of the New York Academy of Sciences. 2010;1191:133–155. - PubMed
Publication types
MeSH terms
Substances
Grants and funding
- U01 MH081984/MH/NIMH NIH HHS/United States
- MH081984/MH/NIMH NIH HHS/United States
- P50 MH066286/MH/NIMH NIH HHS/United States
- U01 MH076989/MH/NIMH NIH HHS/United States
- U01 MH066160/MH/NIMH NIH HHS/United States
- U01MH066160/MH/NIMH NIH HHS/United States
- U01 MH081928/MH/NIMH NIH HHS/United States
- P41 EB015922/EB/NIBIB NIH HHS/United States
- MH081902/MH/NIMH NIH HHS/United States
- MH081988/MH/NIMH NIH HHS/United States
- U01 MH081902/MH/NIMH NIH HHS/United States
- U01 MH081988/MH/NIMH NIH HHS/United States
- 9P41EB015922/EB/NIBIB NIH HHS/United States
- U01 MH082004/MH/NIMH NIH HHS/United States
- U01 MH081944/MH/NIMH NIH HHS/United States
LinkOut - more resources
Full Text Sources
Other Literature Sources
Medical
