. 2014 Apr 15;5(2):e00992.
doi: 10.1128/mBio.00992-14.

Oxygen limitation within a bacterial aggregate

Oxygen limitation within a bacterial aggregate

Aimee K Wessel et al. mBio. .

Abstract

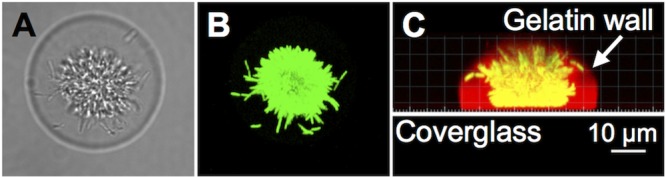
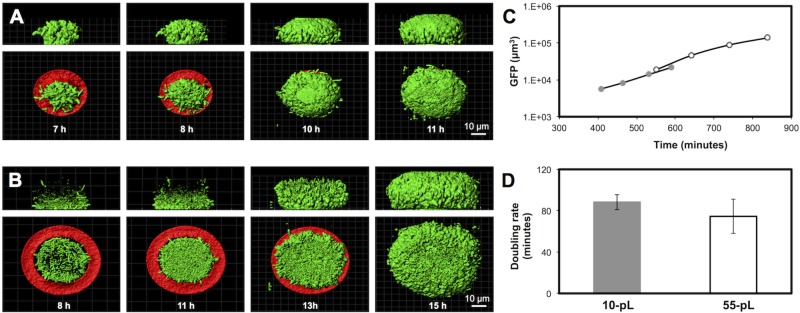
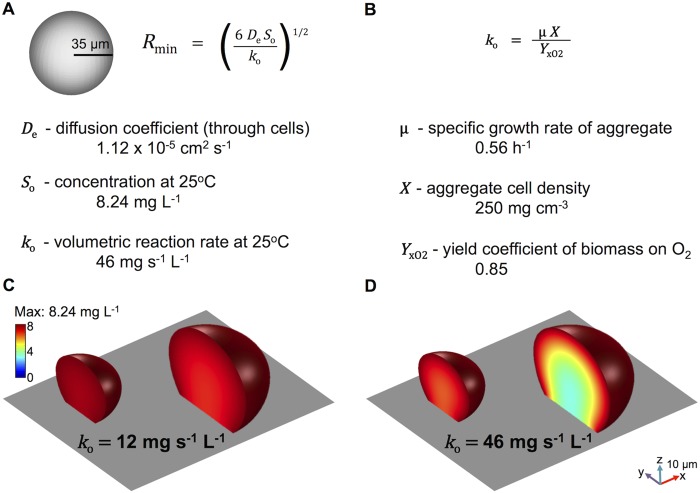
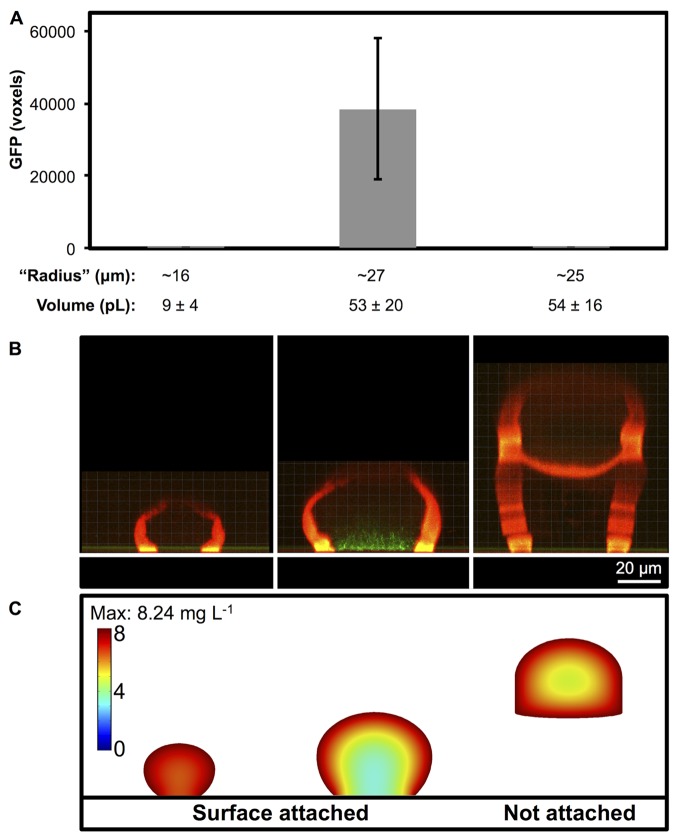
ABSTRACT Cells within biofilms exhibit physiological heterogeneity, in part because of chemical gradients existing within these spatially structured communities. Previous work has examined how chemical gradients develop in large biofilms containing >10(8) cells. However, many bacterial communities in nature are composed of small, densely packed aggregates of cells (≤ 10(5) bacteria). Using a gelatin-based three-dimensional (3D) printing strategy, we confined the bacterium Pseudomonas aeruginosa within picoliter-sized 3D "microtraps" that are permeable to nutrients, waste products, and other bioactive small molecules. We show that as a single bacterium grows into a maximally dense (10(12) cells ml(-1)) clonal population, a localized depletion of oxygen develops when it reaches a critical aggregate size of ~55 pl. Collectively, these data demonstrate that chemical and phenotypic heterogeneity exists on the micrometer scale within small aggregate populations. IMPORTANCE Before developing into large, complex communities, microbes initially cluster into aggregates, and it is unclear if chemical heterogeneity exists in these ubiquitous micrometer-scale aggregates. We chose to examine oxygen availability within an aggregate since oxygen concentration impacts a number of important bacterial processes, including metabolism, social behaviors, virulence, and antibiotic resistance. By determining that oxygen availability can vary within aggregates containing ≤ 10(5) bacteria, we establish that physiological heterogeneity exists within P. aeruginosa aggregates, suggesting that such heterogeneity frequently exists in many naturally occurring small populations.


Figures

FIG 1
FIG 1
A P. aeruginosa aggregate confined within a 3D printed microtrap. (A, B) Transmitted light image and green channel images of a gelatin-based microtrap containing ∼104 P. aeruginosa constitutively expressing GFP (green). Shown are views from the top of the microtrap. (C) Side view image of the microtrap shown in panels A and B with walls (red) surrounding bacteria (yellow in this image). Images were acquired by confocal microscopy, and a 3D reconstruction of red and green channel stacks was prepared with Imaris.
FIG 2
FIG 2
P. aeruginosa grows at normal rates when confined to densities of >108 cells ml−1. (A, B) P. aeruginosa PAO1 constitutively expressing gfp was captured inside a small microtrap (A) or a large microtrap (B) surrounded by 500 µl of growth medium. Images represent confocal fluorescence data within the microtrap over time (analyzed in Imaris, Isosurface mode). In the aggregate side view (top panels), the microtrap was digitally removed for clarity. In the bottom panels, the microtrap base is displayed (red) but the walls were digitally removed. The growth rate was calculated by determining the total GFP voxels detected inside the microtrap at multiple time points. (C) Representative P. aeruginosa growth curves for small microtraps (closed gray circles) and large microtraps (open circles). (D) Average growth rates (in minutes) in small and large microtraps. Error bars represent standard deviations, n = ≥3.
FIG 3
FIG 3
Prediction of the minimum aggregate size required for oxygen depletion within an aggregate. (A, B) A previously described calculation that predicts the minimum size of a spherical aggregate necessary to deplete a solute at its center was used (2). (A) The diffusion coefficient (De) of oxygen through a population of densely packed bacteria is 1.12 × 10⁻⁵ cm2 s−1 (35, 36), and the concentration of oxygen (So) in the aqueous environment at 25°C is 8.24 mg liter−1, the maximum amount that can be dissolved in water under ambient conditions. (B) The volumetric reaction rate of oxygen within the aggregate (ko = 46 mg s−1 liter−1) was calculated by using a P. aeruginosa specific growth rate of 0.56 h−1 (75 min) and the density of cells within the aggregate, 250 mg cm−3 (1012 cells ml−1) (for a more thorough explanation see Fig. 2; see Fig. S1A in the supplemental material) (2, 37). On the basis of these values, an Rmin of 35 µm was calculated. (C, D) Surface-attached 15- and 60-pl populations (radii of 17 and 27 µm, respectively) generated from representative aggregate measurements were used to predict the steady-state oxygen concentration profile within the aggregate microenvironment, given by ∇2c = −ko, where c is the oxygen concentration and ko is the oxygen uptake rate per unit volume of cells. The oxygen concentration in the external medium is assumed to be at saturation. The equation was solved via finite-element simulations in three dimensions, assuming that there was no penetration at the glass coverslip boundary. The highly porous microtrap wall was assumed not to pose a significant diffusive barrier to oxygen (24, 25). The simulations for each representative aggregate size and shape were implemented in COMSOL.
FIG 4
FIG 4
Oxygen gradients within aggregates of various sizes and shapes. (A, B) P. aeruginosa carrying a cbb3-2::gfp transcriptional fusion (pAW9) was captured inside microtraps with different inner volumes. When they are filled to capacity, no GFP expression is observed in the small microtraps (left), while significant GFP expression is observed in the larger microtraps (center). P < 0.04 via two-tailed Student t test (n = ≥13). When a 55-pl microtrap is raised on stilts, GFP is not observed (right). (A) Average volumes (± standard deviations) are listed below the bar graph. For simplicity in the text, the volumes have been rounded to the nearest 5-pl increment. (B) Representative side view confocal images display small and large surface-attached aggregates and a large aggregate suspended above the coverslip floor (represented as a white bar at the base). Portions of the microtrap walls have been digitally removed for clarity. The average volume of the large suspended aggregates (right panel) contained the same average volume as the large surface-attached aggregates (center panel) but with an additional exposed surface at the aggregate base. With an increased surface area-to-volume ratio, the suspended aggregate did not express detectable levels of GFP. (C) Lateral slices generated from mathematical simulations by using representative aggregate shapes (see Materials and Methods for details of the simulation parameters).

References

    1. Stewart PS, Franklin MJ. 2008. Physiological heterogeneity in biofilms. Nat. Rev. Microbiol. 6:199–210. 10.1038/nrmicro1838 - DOI - PubMed
    1. Stewart PS. 2003. Diffusion in biofilms. J. Bacteriol. 185:1485–1491. 10.1128/JB.185.5.1485-1491.2003 - DOI - PMC - PubMed
    1. Costerton JW, Lewandowski Z, DeBeer D, Caldwell D, Korber D, James G. 1994. Biofilms, the customized microniche. J. Bacteriol. 176:2137–2142 - PMC - PubMed
    1. Walters MC, III, Roe F, Bugnicourt A, Franklin MJ, Stewart PS. 2003. Contributions of antibiotic penetration, oxygen limitation, and low metabolic activity to tolerance of Pseudomonas aeruginosa biofilms to ciprofloxacin and tobramycin. Antimicrob. Agents Chemother. 47:317–323. 10.1128/AAC.47.1.317-323.2003 - DOI - PMC - PubMed
    1. Lenz AP, Williamson KS, Pitts B, Stewart PS, Franklin MJ. 2008. Localized gene expression in Pseudomonas aeruginosa biofilms. Appl. Environ. Microbiol. 74:4463–4471. 10.1128/AEM.00710-08 - DOI - PMC - PubMed

Publication types

MeSH terms