. 2014 Apr 16:5:3633.
doi: 10.1038/ncomms4633.

MHC-I expression renders catecholaminergic neurons susceptible to T-cell-mediated degeneration

Affiliations

MHC-I expression renders catecholaminergic neurons susceptible to T-cell-mediated degeneration

Carolina Cebrián et al. Nat Commun. .

Abstract

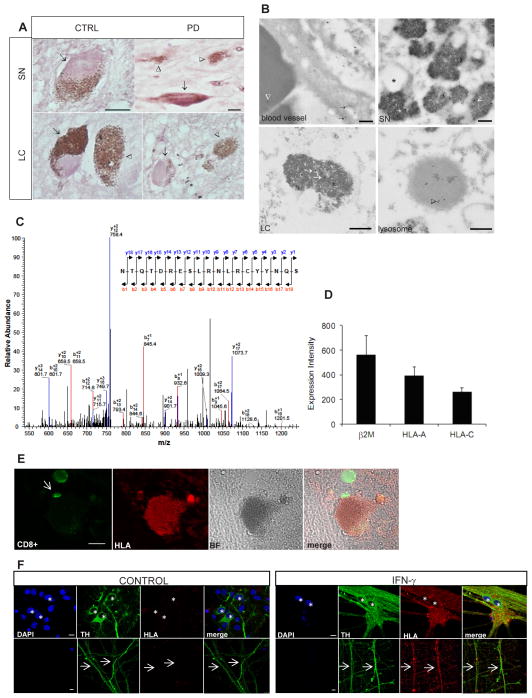
Subsets of rodent neurons are reported to express major histocompatibility complex class I (MHC-I), but such expression has not been reported in normal adult human neurons. Here we provide evidence from immunolabel, RNA expression and mass spectrometry analysis of postmortem samples that human catecholaminergic substantia nigra and locus coeruleus neurons express MHC-I, and that this molecule is inducible in human stem cell-derived dopamine (DA) neurons. Catecholamine murine cultured neurons are more responsive to induction of MHC-I by gamma-interferon than other neuronal populations. Neuronal MHC-I is also induced by factors released from microglia activated by neuromelanin or alpha-synuclein, or high cytosolic DA and/or oxidative stress. DA neurons internalize foreign ovalbumin and display antigen derived from this protein by MHC-I, which triggers DA neuronal death in the presence of appropriate cytotoxic T cells. Thus, neuronal MHC-I can trigger antigenic response, and catecholamine neurons may be particularly susceptible to T-cell-mediated cytotoxic attack.


Conflict of interest statement

Competing financial interests

The authors declare no competing financial interests.

Figures

Figure 1
Figure 1. Human SN and LC express MHC-I
A) Fluorescent images showing double immunolabel for the neuronal nuclei marker, Fox-3 (green) and human MHC-I (HLA A, B and C, red) in human postmortem hippocampal/entorhinal cortex sections and striatal sections from control individuals. White circles demonstrate that there is no overlap between neurons and HLA+ structures. Scale = 60 μm. B, C) Brightfield and immunofluorescence images of SN stained for B) HLA A, B, and C (red) and TH (green) and C) β2m (red) and TH (green). NM was identified under brightfield illumination. Encircled neurons demonstrate that TH+ neurons display HLA immunolabel, overlapping in particular with NM. Scale = 100 μm. D) Confocal immunofluorescent label of TH (green) and HLA (A, B and C, red) in SN and LC control and PD samples. The first row shows a representative example of a SN DA neuron that does not express HLA. When HLA was observed in SN and LC neurons (examples in the second through fifth rows), it was often associated with NM. Scale = 50 μm. E and F) Proportion of TH+ neurons with HLA (A, B and C) immunolabel in the SN (E) and the LC (F). Cell counts were performed in three sections per brain of 8 control individuals and 8 PD patients (SN) and 8 control individuals and 9 PD patients (LC). Data are presented as the mean ± SEM. p > 0.05 (ns) in E (Mann-Whitney U test) and * p < 0.05 in F (Mann-Whitney U test). G) Percentage of TH+ and TH neurons in the SN and LC (control and PD) labeled for HLA. The arrows in all panels point to blood vessels. Each experiment was repeated at least in triplicate. BF = brightfield; CTRL = control; ns = non significant.
Figure 2
Figure 2. Human SN and LC express MHC-I with local CTLs
A) V-VIP immunostain (purple) indicates HLA (A, B and C) in control and PD SN and LC samples. NM appears as brown precipitate. Arrows indicate labeled cells in which the chromogen fills and outlines cell bodies and occasional dendrites. The arrowhead indicates a NM+ neuron devoid of cytosolic immunocytochemical label. Scale = 50 μm. B) Immunoelectron microscopy images demonstrating antigenicity to HLA (A, B and C) within NM granules of control SN and LC (white arrows). Blood vessel endothelium was used as a positive control for the HLA antibody and showed immunolabel (black arrows); the erythrocyte showed very little staining (white outlined arrowhead). Lipid bodies (asterisk) within NM organelles did not exhibit HLA immunolabel. The black outlined arrowhead depicts a lysosome with HLA label in an LC neuron. Scale = 250 nm. C) MS/MS spectrum (parent ion m/z 788.2=[M+3H+]3+) corresponding to the peptide NTQTDRESLRNLRCYYNQS observed in the analysis of NM isolated from SN tissue. See Table 1 for details. D) β2m, HLA-A, and HLA-C genes are robustly expressed in laser-captured NM SN neurons of control individuals. Data are presented as the mean ± SEM. Samples from 17 control subjects were analyzed. E) Double immunofluorescence in the SN of human of a postmortem control sample. NM was observed under brightfield microscopy. An arrow indicates a CD8+ T-cell in contact with a NM+ neuron. Scale = 10 μm. F) Immunofluorescence in hES derived DA neurons, showing HLA (A, B and C) immunolabel in the cell body (upper panel) and dendrites (lower panel) of TH+ neurons exposed to human IFN-γ, but not in neurons treated with the vehicle. Asterisks indicate cell bodies and arrows point at dendrites. Scale = 10 μm. Each experiment was repeated at least in triplicate, and within each experiment, each condition was also performed at least three times. BF = brightfield; CTRL = control.
Figure 3
Figure 3. Induced MHC-I by murine catecholamine neurons
A) MHC-I immunolabel in postnatally-derived cultured SN DA neurons from wild type and β2m KO mice imaged by confocal microscopy. The upper row shows untreated DA (TH: green) neurons. The bottom row shows MHC-I (red) expressing DA neurons exposed to IFN-γ. The arrow indicates a MHC-I expressing astrocyte (bottom row). Scale = 30 μm. B) Dose response of MHC-I induction by IFN-γ in neurons obtained from various brain regions. Data are presented as the mean ± SEM (ns = nonsignificant; ** p < 0.01; *** p < 0.001, Two-way ANOVA test). C) IFN-γ released by microglia stimulated with LPS, NM or α-syn. Data are presented as the mean ± SEM (** p < 0.01; *** p < 0.001, One-way ANOVA with Tukey post-hoc test). D) Expression of MHC-I after exposing primary VM neurons to medium from microglia pre-stimulated with LPS, NM or α-syn (wild type, nitrated or A53T mutant). Data are presented as the mean ± SEM (* p < 0.05; ** p < 0.01; *** p < 0.001, One-way ANOVA with Tukey post-hoc test). E) Percentage of VM neurons that expressed MHC-I after exposure to microglial conditioned as in C), with or without a neutralizing antibody for IFN-γ. Data are presented as the mean ± SEM (ns = nonsignificant; * p < 0.05; ** p < 0.01, two-tailed Student’s T-test). Each experiment was repeated at least in triplicate, and within each experiment, each condition was also performed at least three times. For each condition, neurons on n = 24 fields at 20X were quantified. ab = antibody; CTRL = control; ns = nonsignificant; WT = wild type.
Figure 4
Figure 4. MHC-I induction in VM DA neurons is dependent on oxidative stress
A) Example of TH/MHC-I double immunolabel of primary cultures of VM neurons after treatment with L-DOPA, which induced the presence of both NM (arrow) and MHC-I. Scale = 30 μm. B) Fraction of TH+ and TH neurons that displayed NM following L-DOPA. Data are presented as mean ± SEM (ns = nonsignificant, two-tailed Student’s T-test). C) The fraction of TH+ and TH neurons that displayed plasma membrane MHC-I following L-DOPA. Data are presented as mean ± SEM (* p < 0.05, two-tailed Student’s T-test). Each experiment was repeated at least in triplicate and within each experiment, each condition was also performed at least three times. For each condition, neurons on n = 24 fields at 20X were quantified. BF = brightfield; CTRL = control.
Figure 5
Figure 5. VM DA neurons load and display antigen
A) VM DA neurons immunolabeled for TH and SIINFEKL-MHC-I. B) The fraction of TH+ neurons that were labeled for SIINFEKL-MHC-I following vehicle, IFN-γ, OVA, IFN-γ + SIINFEKL, and IFN-γ + OVA. Data are presented as the mean ± SEM (*** p < 0.001, One-way ANOVA with Tukey post-hoc test). Each experiment was repeated at least in triplicate and within each experiment, each condition was also performed at least three times. For each condition, neurons on n = 24 fields at 20X were quantified. Scale = 30 μm. IFN = interferon gamma; SIIN = SIINFEKL; Veh = vehicle.
Figure 6
Figure 6. VM DA neurons that display antigen are killed by CD8+ T cells
A) The fraction of VM DA neurons surviving in the presence of SIINFEKL, OT-1 cells pre-pulsed with SIINFEKL, and IFN-γ (100 ng/ml) in cultures obtained from wild type and β2m KO mice. Data are presented as the mean ± SEM (ns = non significant; ** p < 0.01, One-way ANOVA with Tukey post-hoc test). B) Survival of VM DA neurons incubated with IFN-γ, SIINFEKL peptide, and OT-1 cells with the pan-caspase inhibitor Z-VAD-FMK, the Fas/Fas ligand antagonist, Kp7-6, the perforin/granzyme antagonist, concanamycin A, or the combination of Kp7-6 and concanamycin A. Data are presented as the mean ± SEM (ns = non significant; * p < 0.05, *** p < 0.001, One-way ANOVA with Tukey post-hoc test). C) VM DA neuron survival with SIINFEKL, OT-1 cells pre-pulsed with SIINFEKL, and microglial medium previously exposed to LPS, α-syn or NM. Data are presented as the mean ± SEM (ns = non significant; * p < 0.05, ** p < 0.01; *** p < 0.001, One-way ANOVA with Tukey post-hoc test). Each experiment was repeated at least in triplicate and within each experiment, each condition was also performed at least three times. For each condition, neurons on n = 24 fields at 20X were quantified. ConA = concanamycin A; CTRL = control; IFN = interferon gamma; ns = non significant; SIIN = SIINFEKL; Veh = vehicle.

References

    1. Chemali M, Radtke K, Desjardins M, English L. Alternative pathways for MHC class I presentation: a new function for autophagy. Cell Mol Life Sci. 2011;68:1533–1541. - PMC - PubMed
    1. Wong GH, Bartlett PF, Clark-Lewis I, Battye F, Schrader JW. Inducible expression of H-2 and Ia antigens on brain cells. Nature. 1984;310:688–91. - PubMed
    1. Neumann H, Cavalié A, Jenne DE, Wekerle H. Induction of MHC class I genes in neurons. Science. 1995;28, 269(5223):549–52. - PubMed
    1. Lindå H, Hammarberg H, Piehl F, Khademi M, Olsson T. Expression of MHC class I and beta2-microglobulin in rat spinal motoneurons: regulatory influences by IFN-gamma and axotomy. Exp Neurol. 1999;150:282–295. - PubMed
    1. Huh SG, Boulanger LM, Du H, Riquelme PA, Brotz TM, Shatz CJ. Functional requirement for class I MHC in CNS development and plasticity. Science. 2000;290:2155–9. - PMC - PubMed

Publication types

MeSH terms