

National patterns in environmental injustice and inequality: outdoor NO2 air pollution in the United States
- PMID: 24736569
- PMCID: PMC3988057
- DOI: 10.1371/journal.pone.0094431
National patterns in environmental injustice and inequality: outdoor NO2 air pollution in the United States
Abstract
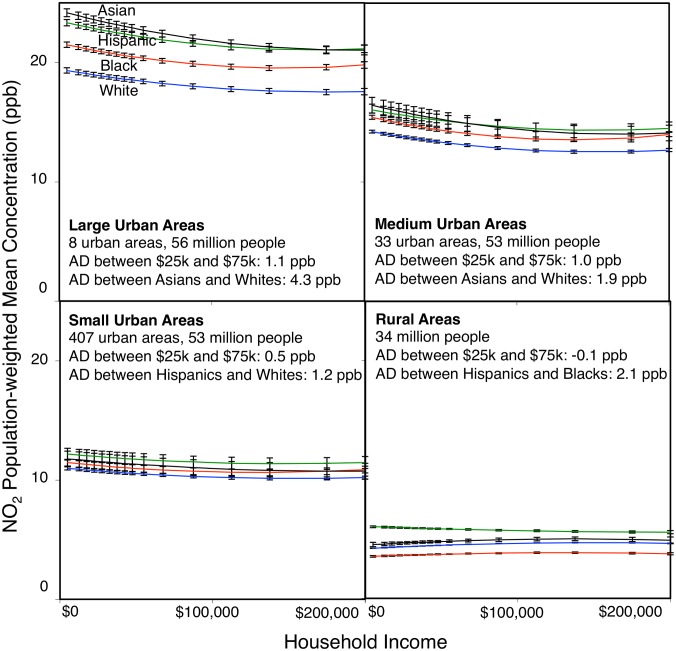
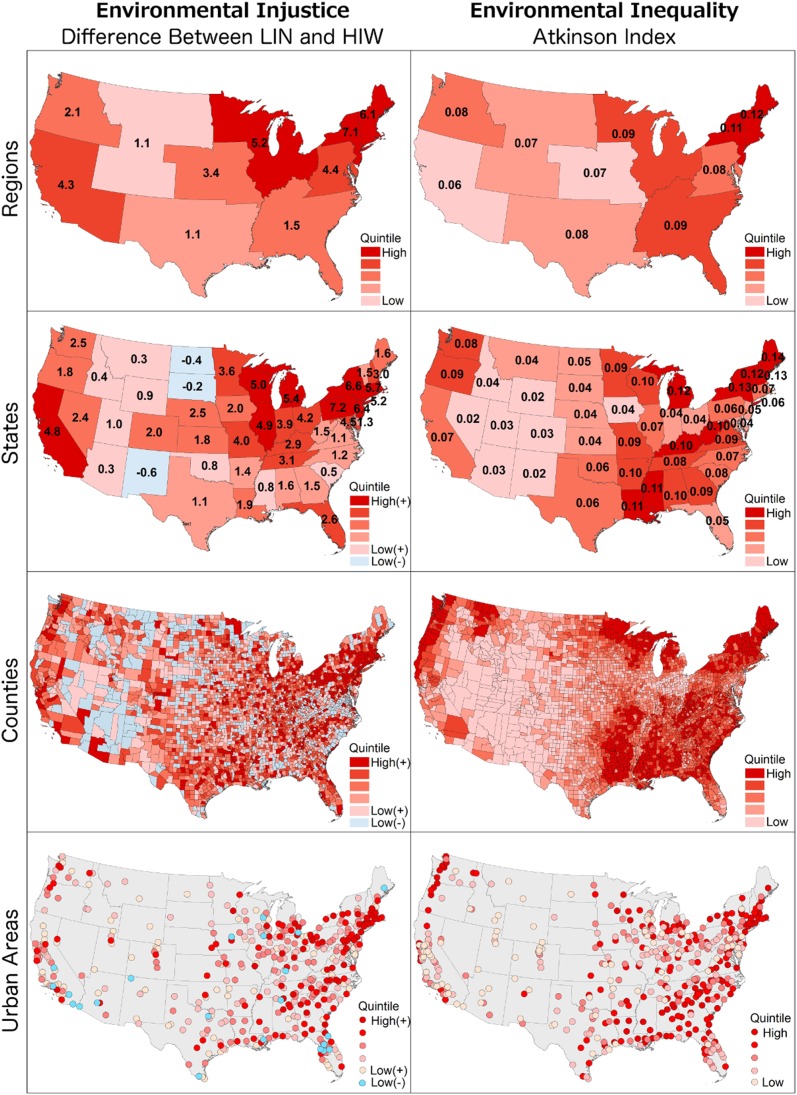
We describe spatial patterns in environmental injustice and inequality for residential outdoor nitrogen dioxide (NO2) concentrations in the contiguous United States. Our approach employs Census demographic data and a recently published high-resolution dataset of outdoor NO2 concentrations. Nationally, population-weighted mean NO2 concentrations are 4.6 ppb (38%, p<0.01) higher for nonwhites than for whites. The environmental health implications of that concentration disparity are compelling. For example, we estimate that reducing nonwhites' NO2 concentrations to levels experienced by whites would reduce Ischemic Heart Disease (IHD) mortality by ∼7,000 deaths per year, which is equivalent to 16 million people increasing their physical activity level from inactive (0 hours/week of physical activity) to sufficiently active (>2.5 hours/week of physical activity). Inequality for NO2 concentration is greater than inequality for income (Atkinson Index: 0.11 versus 0.08). Low-income nonwhite young children and elderly people are disproportionately exposed to residential outdoor NO2. Our findings establish a national context for previous work that has documented air pollution environmental injustice and inequality within individual US metropolitan areas and regions. Results given here can aid policy-makers in identifying locations with high environmental injustice and inequality. For example, states with both high injustice and high inequality (top quintile) for outdoor residential NO2 include New York, Michigan, and Wisconsin.
Conflict of interest statement
Figures
References
-
- Anderson SJ, Gardner BW, Moll BJ, Tribble GL, Webster TF, et al. (1978) Correlation between air pollution and socio-economic factors in Los Angeles County. Atmos Environ 12: 1531–1535.
-
- Council on Environmental Quality (1971) Environmental quality: the second annual report of the council on environmental quality (US Government Printing Office, Washington, DC).
-
- General Accounting Office (1983) Siting of hazardous waste landfills and their correlation with racial and economic status of surrounding communities (Rep. GAO/RCED-83-168, General Accounting Office, Washington, DC).
-
- United Church of Christ Commission for Racial Justice (1987) Toxic wastes and race in the United States: A national report on the racial and socio-economic characteristics of communities surrounding hazardous waste sites (UCCRJ: New York, NY, USA).
-
- Van Arsdol MD (1966) Metropolitan growth and environmental hazards: an illustrative case. Ekistics 21: 48–50.
Publication types
MeSH terms
Substances
LinkOut - more resources
Full Text Sources
Other Literature Sources
Medical
