

The performance of enhanced liver fibrosis (ELF) test for the staging of liver fibrosis: a meta-analysis
- PMID: 24736610
- PMCID: PMC3988013
- DOI: 10.1371/journal.pone.0092772
The performance of enhanced liver fibrosis (ELF) test for the staging of liver fibrosis: a meta-analysis
Abstract
Background: The enhanced liver fibrosis test (ELF) has been shown to accurately predict significant liver fibrosis in several liver diseases.
Aims: To perform a meta-analysis to assess the performance of the ELF test for the assessment of liver fibrosis.
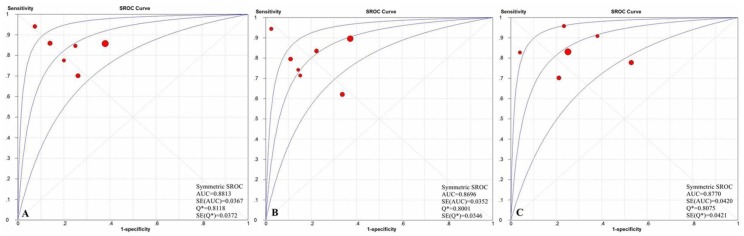
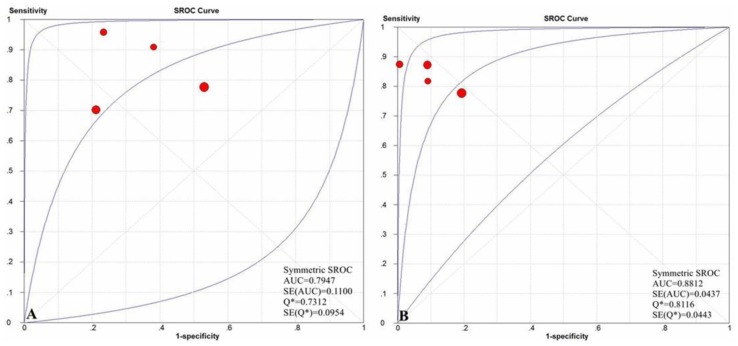
Study: Electronic and manual searches were performed to identify studies of the ELF test. After methodological quality assessment and data extraction, pooled estimates of the sensitivity, specificity, area under the receiver operating characteristic curve (AUROC), positive likelihood ratio (PLR), negative likelihood ratio (NLR), diagnostic odds ratio (DOR) and summary receiver operating characteristics (sROC) were assessed systematically. The extent of heterogeneity and reasons for it were assessed.
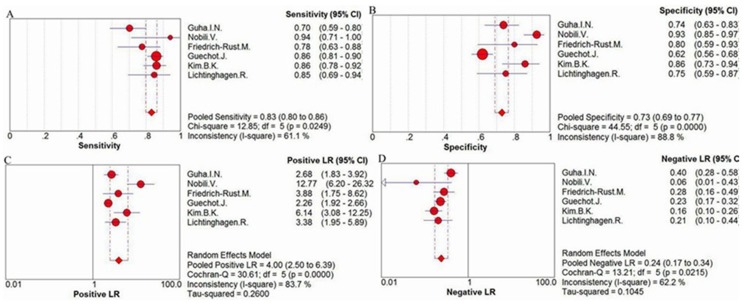
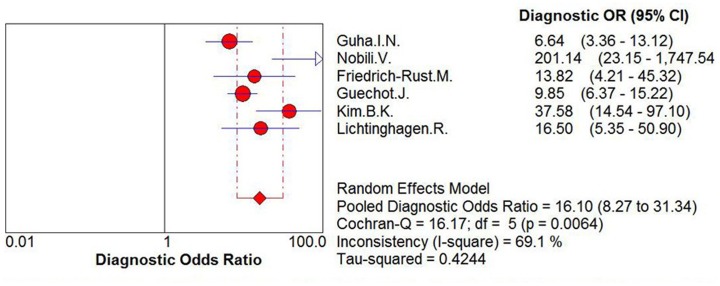
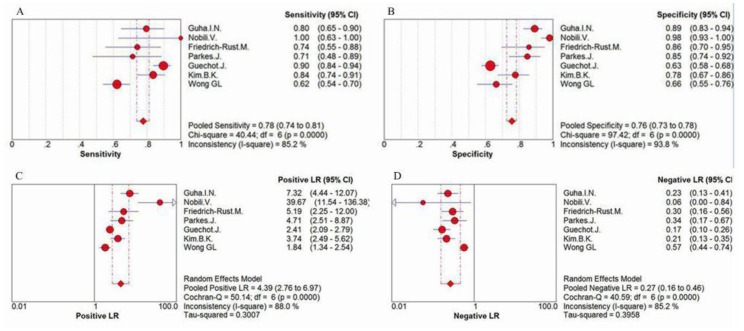
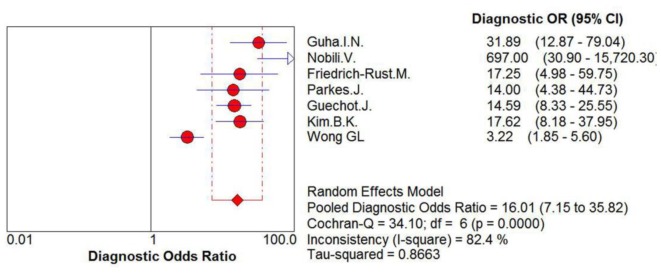
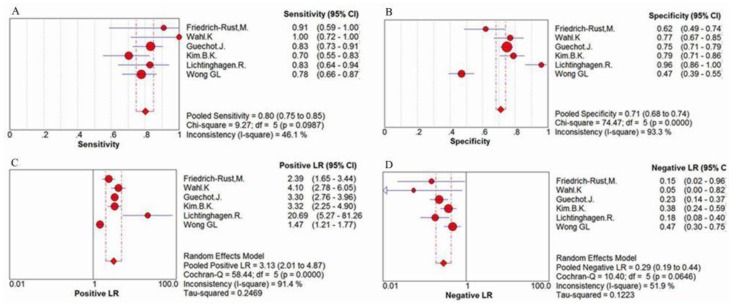
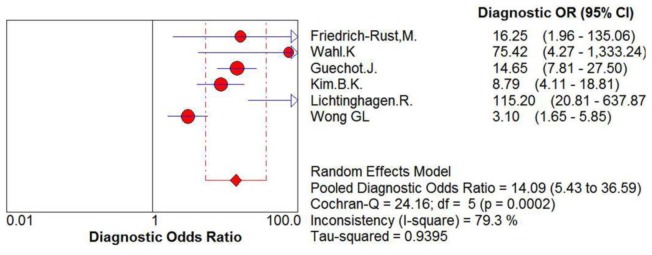
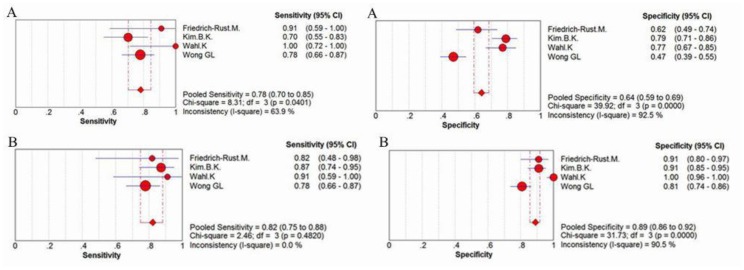
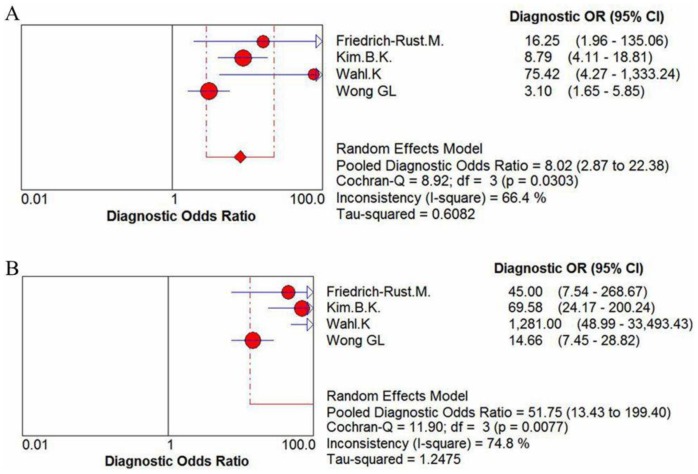
Results: Nine studies were identified for analysis. The pooled sensitivity, specificity, positive LR, negative LR, and DOR values of ELF test, for assessment of significant liver fibrosis, were 83% (95% CI=0.80-0.86), 73% (95% CI=0.69-0.77), 4.00 (95% CI=2.50-6.39), 0.24 (95% CI=0.17-0.34), and 16.10 (95% CI=8.27-31.34), respectively; and, for evaluation of severe liver fibrosis, were 78% (95% CI=0.74-0.81), 76% (95% CI=0.73-0.78), 4.39 (95% CI=2.76-6.97), 0.27 (95% CI=0.16-0.46), and 16.01 (95% CI: 7.15-35.82), respectively; and, for estimation of cirrhosis, were 80% (95% CI=0.75-0.85), 71% (95% CI=0.68-0.74), 3.13 (95% CI=2.01-4.87), 0.29 (95% CI=0.19-0.44), and 14.09 (95% CI: 5.43-36.59), respectively.
Conclusions: The ELF test shows good performance and considerable diagnostic value for the prediction of histological fibrosis stage.
Conflict of interest statement
Figures

Similar articles
-
Performance of the Enhanced Liver Fibrosis Test to Estimate Advanced Fibrosis Among Patients With Nonalcoholic Fatty Liver Disease.JAMA Netw Open. 2021 Sep 1;4(9):e2123923. doi: 10.1001/jamanetworkopen.2021.23923. JAMA Netw Open. 2021. PMID: 34529067 Free PMC article.
-
Meta-analysis: Enhanced liver fibrosis test to identify hepatic fibrosis in chronic liver diseases.Aliment Pharmacol Ther. 2023 Apr;57(7):750-762. doi: 10.1111/apt.17385. Epub 2023 Jan 17. Aliment Pharmacol Ther. 2023. PMID: 36650720 Review.
-
Diagnostic accuracy of red blood cell distribution width to platelet ratio for predicting staging liver fibrosis in chronic liver disease patients: A systematic review and meta-analysis.Medicine (Baltimore). 2019 Apr;98(14):e15096. doi: 10.1097/MD.0000000000015096. Medicine (Baltimore). 2019. PMID: 30946368 Free PMC article.
-
Accuracy of the Enhanced Liver Fibrosis Test vs FibroTest, Elastography, and Indirect Markers in Detection of Advanced Fibrosis in Patients With Alcoholic Liver Disease.Gastroenterology. 2018 Apr;154(5):1369-1379. doi: 10.1053/j.gastro.2018.01.005. Epub 2018 Jan 6. Gastroenterology. 2018. PMID: 29317276
-
Enhanced liver fibrosis panel as a predictor of liver fibrosis in chronic hepatitis C patients.J Clin Gastroenterol. 2015 Mar;49(3):235-41. doi: 10.1097/MCG.0000000000000128. J Clin Gastroenterol. 2015. PMID: 24714186
Cited by
-
Latent Class Analysis of Noninvasive Methods and Liver Biopsy in Chronic Hepatitis C: An Approach without a Gold Standard.Biomed Res Int. 2017;2017:8252980. doi: 10.1155/2017/8252980. Epub 2017 Sep 13. Biomed Res Int. 2017. PMID: 29057268 Free PMC article.
-
Identifying Patients with Nonalcoholic Fatty Liver Disease in Primary Care: How and for What Benefit?J Clin Med. 2023 Jun 12;12(12):4001. doi: 10.3390/jcm12124001. J Clin Med. 2023. PMID: 37373694 Free PMC article. Review.
-
Asian-Pacific Association for the Study of the Liver (APASL) consensus guidelines on invasive and non-invasive assessment of hepatic fibrosis: a 2016 update.Hepatol Int. 2017 Jan;11(1):1-30. doi: 10.1007/s12072-016-9760-3. Epub 2016 Oct 6. Hepatol Int. 2017. PMID: 27714681
-
Liver fibrosis quantification.Abdom Radiol (NY). 2022 Mar;47(3):1032-1052. doi: 10.1007/s00261-021-03396-y. Epub 2022 Jan 12. Abdom Radiol (NY). 2022. PMID: 35022806 Free PMC article. Review.
-
Fibrosis imaging: Current concepts and future directions.Adv Drug Deliv Rev. 2017 Nov 1;121:9-26. doi: 10.1016/j.addr.2017.10.013. Epub 2017 Nov 20. Adv Drug Deliv Rev. 2017. PMID: 29108860 Free PMC article. Review.
References
-
- National Institutes of Health Consensus Development Conference (2002) National Institutes of Health Consensus Development Conference Statement: Management of hepatitis C: 2002; June 10–12, 2002; Hepatology. 36: S3–20. - PubMed
-
- Bravo AA, Sheth SG, Chopra S (2001) Liver biopsy. N Engl J Med 344: 495–500. - PubMed
-
- Castera L, Negre I, Samii K, Buffet C (1999) Pain experienced during percutaneous liver biopsy. Hepatology 30: 1529–1530. - PubMed
-
- Bedossa P, Dargere D, Paradis V (2003) Sampling variability of liver fibrosis in chronic hepatitis C. Hepatology. 38: 1449–1457. - PubMed
-
- Rousselet MC, Michalak S, Dupre F, Croue A, Bedossa P, et al. (2005) Sources of variability in histological scoring of chronic viral hepatitis. Hepatology 41: 257–264. - PubMed
Publication types
MeSH terms
LinkOut - more resources
Full Text Sources
Other Literature Sources
Medical
